


AP Psych statistics Notes and flash cards
Statistics: Away to organizes data and provide meaning
Descriptive: Organizing and summarizing
Inferential: Interpreting and drawing conclusions
Ways to portray data:
Pie Charts
Histogram/Bar Graph
Typically frequency as the Y axis
Topic of study as X axis
Frequency polygon
Frequency is marked with a point on the graph (bell-shaped)
Typically frequency as the Y axis
Topic of study as X axis
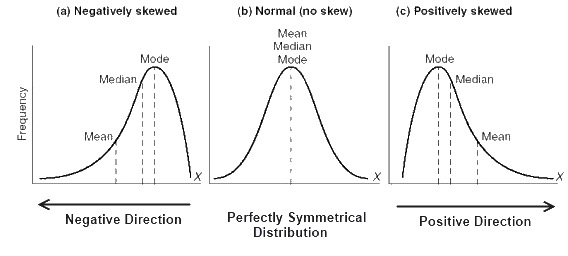
Positively skewed distribution: A distribution with few HIGH scores
Negatively skewed distribution: A distribution with few LOW scores
Measures of central tendency:
Typical score in a distribution of numbers:
Mode: the most frequent
Median: the middle score, when scores and placed in order from least to most
Mean: the average of all scores
The mean is not always the best summary of data
Measures of variability:
Variability: how much scores vary from each other from the MEAN
Range: the difference between the lowest and highest scores
Variance: This measures how different the scores are from each other
Standard Deviation: gives the average distance scores are from the mean
The larger the deviation, the more spread out the scores
High variability: high standard deviation
Low variability: low standard deviation
Statistical significance:
The condition that exists when the probability that the findings are due to chance is less than 1 in 20 (p<.05)
Results are likely due to manipulation of the independent variable and not due to random chance