
U3
Data Collection and "Randomness"
Given that variation may be random or not, conclusions are uncertain.
It's important to consider the role that plays in statistical analysis. While can sometimes make it more difficult to draw conclusions from data, it is not necessarily a problem as long as it is taken into account. 🍀
In fact, is often used to help estimate the precision of statistical conclusions: methods for data collection that do not rely on chance result in untrustworthy conclusions. When data is collected using methods that do not rely on chance, such as convenience sampling or self-selection, it can be difficult to draw reliable conclusions because the data may not be representative of the larger . In such cases, it's important to carefully consider the potential biases in the data and how they may affect the conclusions that are drawn.
Planning a Study
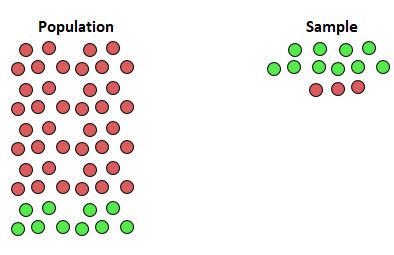
A consists of all items or subjects you're interested in, while a sample selected for study is a subset of the aforementioned . 🏃♂
Source: Medium
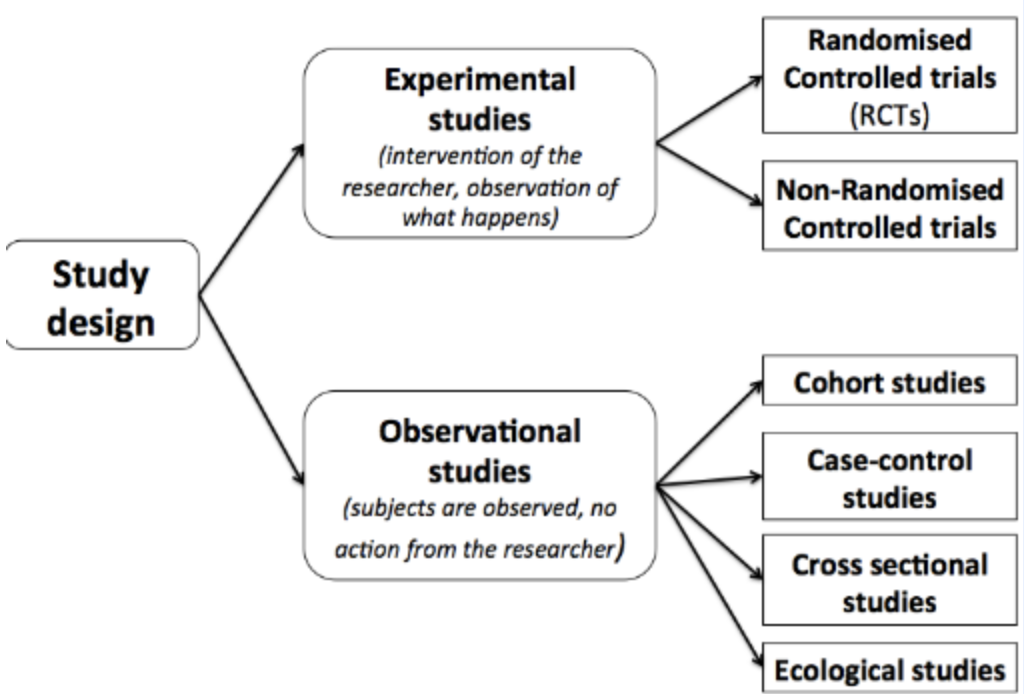
With such ideas in mind, there are different types of studies:
In an , researchers observe and collect data from a sample of individuals, but they do not manipulate or intervene in any way. Observational studies can be either retrospective, in which researchers look back at data that has already been collected, or prospective, in which researchers collect data as the study is being conducted. A is a type of that involves collecting data from a sample of individuals in an attempt to learn about the from which the sample was drawn.
In contrast, an involves manipulating one or more variables and measuring the effect of these manipulations on other variables. Experimental units, such as participants or subjects, are assigned to different conditions or treatments, and the effects of these treatments on the units are measured. Experimental designs allow researchers to establish between variables, because they involve manipulating the variables of interest and measuring their effects on other variables.
It's generally more appropriate to make generalizations about a based on samples that are randomly selected or representative of the , because tends to produce a sample that is more representative of the . If a sample is not representative of the , it may be difficult to draw reliable conclusions about the from the sample.
It's also important to note that it is not possible to determine between variables using data collected in an . Observational studies are useful for identifying between variables, but they cannot establish causality because they do not involve manipulating the variables of interest. To establish a causal relationship, it is generally necessary to use an in which the variables of interest are manipulated and their effects on other variables are measured.
Random Sampling and Data Collection
The way data is collected can have a significant impact on what can be concluded about a . Different data collection methods have different strengths and limitations, and it is important to consider these when interpreting the results of a study. 🎰
Source: Weebly
occurs when an item from a can be selected only once. This means that once an item has been selected, it is not replaced back into the and is no longer available for selection.
, on the other hand, occurs when an item from the can be selected more than once. This means that after an item is selected, it is replaced back into the and is available for selection again.
Studies often employ a multitude of sampling methods: ⌛
A simple random sample (SRS) is a type of random sample in which every member of the has an equal and independent chance of being selected. This is the most basic and unbiased sampling method, and it is often used as a reference point when comparing the results of other sampling methods.
A stratified random sample is a type of random sample in which the is divided into subgroups (strata) based on certain characteristics, and a separate random sample is drawn from each stratum. This method is used when the goal is to ensure that the sample is representative of the different subgroups in the .
A cluster sample is a type of sampling method in which the is divided into groups (clusters), and a random sample of clusters is selected. All members of the selected clusters are included in the sample. This method is often used when it is impractical or too expensive to sample the entire individually, but it can introduce if the clusters are not representative of the larger .
A systematic random sample is a type of random sample in which the members of the are listed in some order, and every nth member is selected for the sample, where n is the sampling interval. This method is easy to implement and can be less expensive than other sampling methods, but it can introduce if the list of members is not truly random.
A is a study in which data is collected from every member of a . This method is the most comprehensive and accurate way to collect data, but it can be very expensive and time-consuming to conduct a .
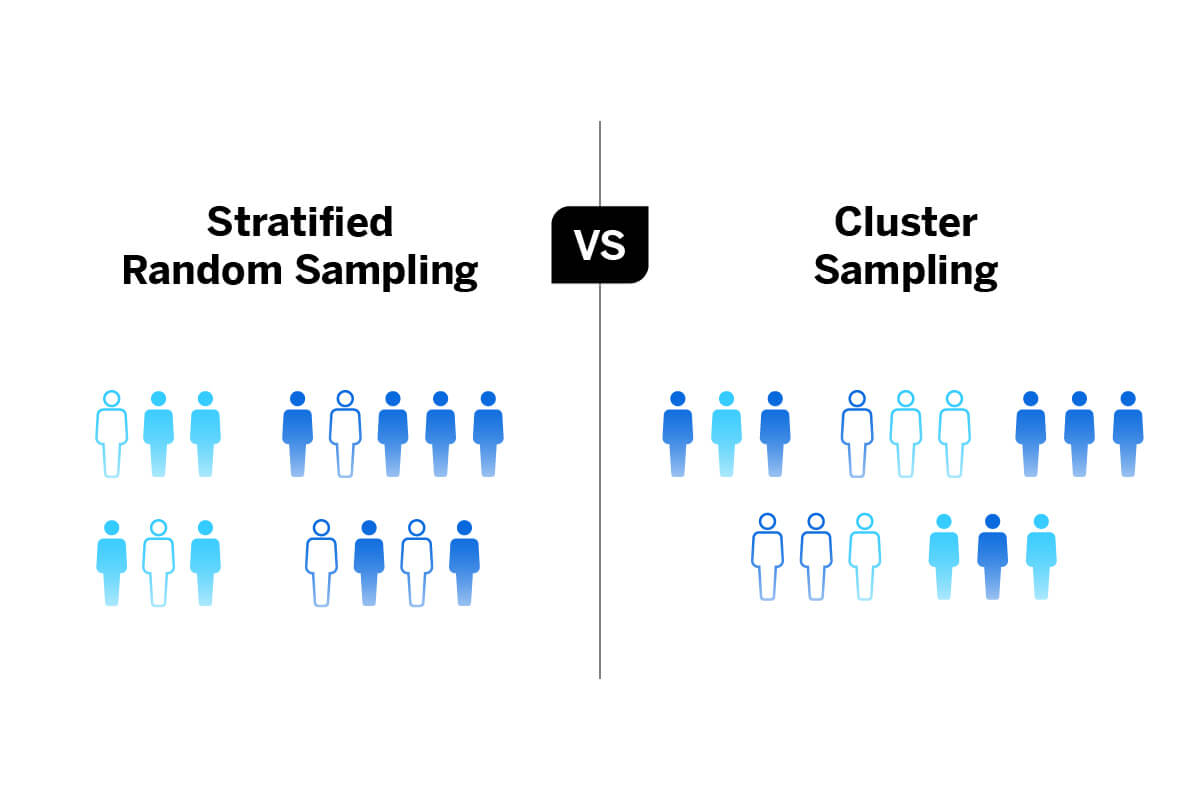
Source: Qualtrics
Biases
occurs when certain responses are systematically favored over others. It can occur in a variety of ways and can have a significant impact on the decisions and actions taken by individuals and organizations. 😔
Source: Statology
Experimental Design
As implied, well-designed experiments can establish evidence of . How do we get to that point, then?
First, let's learn more about the components of an :
In an ,
The experimental units are the individuals or objects that are being studied.
The , also known as factors, are the variables that are manipulated by the experimenter in order to observe the effect on the .
The is the outcome that is measured, and
The are variables that may influence the relationship between the explanatory and response variables, potentially creating a false association.
It is important to control for in order to accurately interpret the results of an .
A well-designed should include the following: 🧪
Comparisons of at least two treatment groups, one of which could be a .
Random assignment/allocation of treatments to experimental units.
Replication (more than one experimental unit in each treatment group).
Control of potential where appropriate.
In a completely randomized experimental design, treatments are randomly assigned to the experimental units, which helps to control for . By randomly assigning treatments, you are more likely to have a balanced distribution of across the different treatment groups, which can help to isolate the effect of the treatment on the .
This is in contrast to a non-randomized design, where the assignment of treatments may be influenced by other factors, which can make it more difficult to attribute any differences in responses to the treatments.
Another way to control is the presence of control groups. A is a group of experimental units that is used as a baseline for comparison. The may either receive no treatment or receive a , which is an inactive substance that has no therapeutic effect. By comparing the responses of the treatment group(s) to the responses of the , you can determine the effect of the treatment on the . Using a helps to control for extraneous variables and allows you to isolate the effect of the treatment on the .
Key Terms to Review (28)
: Bias refers to a systematic deviation from the true value or an unfair influence that affects the results of statistical analysis. It can occur during data collection, sampling, or analysis and leads to inaccurate or misleading conclusions.
: Causal relationships refer to the cause-and-effect connections between variables, where changes in one variable directly influence changes in another variable.
: A census is a complete collection of data from every member of a population. It aims to gather information about each individual or item in the entire population.
: Cluster sampling is a sampling technique where the population is divided into groups or clusters, and a random sample of clusters is selected. Then, all individuals within the selected clusters are included in the sample.
Completely Randomized Experimental Design
: A completely randomized experimental design is when participants are randomly assigned to different treatments or interventions in order to minimize bias and increase validity of results.
: Confounding variables are additional factors that are not accounted for in a study but can influence both the independent and dependent variables. They can lead to incorrect conclusions about cause-and-effect relationships.
: The control group refers to the group of participants in an experiment who do not receive any treatment or intervention. They serve as a baseline for comparison with the treatment group.
: Correlations represent the statistical association or relationship between two or more variables. They indicate how closely related these variables are without implying causation.
: An experiment is a scientific study in which researchers manipulate one or more variables to observe the effect on another variable, while controlling for other factors.
: Experimental design refers to the process of planning and conducting an experiment to investigate cause-and-effect relationships between variables. It involves defining treatments, assigning participants to different groups, and controlling for confounding factors to ensure valid results.
: Explanatory variables are independent variables used in statistical models or experiments to explain or predict changes in another variable. They are also known as predictor variables or factors.
: Definition: A sample is a subset of individuals or objects taken from a larger population to gather information and make inferences about the entire population.
: An observational study is a research method where researchers observe subjects without intervening or manipulating any variables. They collect data by watching subjects' behaviors or characteristics.
: A placebo is a substance or treatment that has no therapeutic effect, but is given to participants in a study as if it were an active treatment. It is used to compare the effects of the active treatment being studied.
: The population refers to the entire group of individuals or objects that we want to study and draw conclusions about in statistics.
: A prospective study is a research design that follows participants over time to collect data and observe outcomes as they occur. It involves identifying a group of individuals at the start of the study and tracking them forward in time.
: Random sampling is a method of selecting individuals from a population in such a way that every individual has an equal chance of being chosen. It helps to ensure that the sample represents the population accurately.
: Random selection refers to the process of selecting individuals from a population in such a way that every individual has an equal chance of being chosen.
: Random variation refers to the natural variability or differences that occur in a set of data due to chance. It is the result of factors that are not controlled or accounted for in an experiment or study.
: The response variable is the outcome or result that researchers measure and analyze in an experiment. It represents the effect or output of interest.
: A retrospective study is a research design that looks back in time to analyze data and investigate the relationship between variables. It involves collecting data from past events or records.
: A sample survey is a method used to collect information about characteristics or opinions of a population by surveying a subset, or sample, of that population. It involves selecting a representative group and gathering data through questionnaires or interviews.
: Sampling techniques are methods used to select a subset of individuals or items from a larger population for the purpose of gathering data and making inferences about the population.
: Sampling with replacement refers to the process of selecting individuals from a population in such a way that after each selection, the individual is put back into the population before the next selection.
4.1: Sampling and Surveys
census (data from entire population) is often infeasible → survey sample instead
random sampling gets rid of personal choice (voluntary response) and sampling bias (convenience)
biased = consistently either over/underestimates actual value
methods: hat, RNG (just like psych)
SRS of size n: every group of n individuals in population has equal chance to be selected as sample (also every individual has equal chance of being selected)
when using table: skip duplicates, since experimental units have distinct assigned numbers
stratified random sample: given that certain groups have known differences, classify population into strata (group of similar individuals), then combine SRSs
if given locations each with vastly different numbers of people, use stratified random sample, not cluster (since clusters are treated as individuals)
cluster sample: classify population into clusters (by location), take SRS of the clusters (cluster = individual)
what random sampling doesn’t get rid of: undercoverage, nonresponse (post-choosing individuals), response bias (systematically incorrect responses), wording bias
4.2: Experiments
observational study: no manipulation
experiment: cause/effect
controls (does not eliminate, rather attempts to average out differences) confounding: comparison (most important; even voluntary sample compared with control group can show difference), random assignment (to create roughly equivalent groups), control, replication
completely randomized design: random assignment
double-blind gets rid of experimenter/researcher biases and placebo effect (just like psych)
statistically significant: observed effect is too unlikely to have occurred by chance (see chapter 9)
{block:experiment} as {strata:observational study} (splitting up based on preexisting differences)
randomized block design: split into blocks, then repeat experiment in each block, compare results between blocks
matched pairs: type of randomized block design (pairs=blocks)
1 unit gets 1st treatment, other gets 2nd (subjectively matched to be similar, then randomize who gets which treatment)
pair can also be single individual (randomize order of treatment)
distribution of differences of each pair (one population, one list)
4.3: Using Studies Wisely
random sampling allows inference about population (often experiments don’t have this; results only apply to “subjects like these”)
random assignment allows inference about cause and effect
criteria for causation w/o experiment: replicable association, chronology, plausibility, etc.
: Sampling without replacement refers to the process of selecting individuals from a population in such a way that once an individual is selected, they are not put back into the population before the next selection.
: A simple random sample (SRS) is a subset of individuals selected from a larger population in such a way that every individual has an equal chance of being chosen and all possible samples have the same probability of being selected.
: Statistical inference involves using sample data to make conclusions or predictions about a larger population. It allows us to draw meaningful insights and make decisions based on limited information.
: Systematic sampling is a sampling technique where every nth individual is selected from the population after randomly choosing a starting point. The interval between selections remains constant throughout the process.