


ECON308
Chapter 1
The Bond Market and Interest Rates
- A security (financial instrument) is a claim on the issuer’s future income or assets
- A bond is a debt security that promises to make payments periodically for a specified period of time
- An interest rate is the “cost of borrowing” or the price paid for the rental of funds
Money, Business Cycles, and Inflation
- An aggregate price level is the average price of goods and services in an economy
- A continual rise in the price level (inflation) affects all economic players
Money and Interest Rates
- Interest rates are the “price of money”
- Very important for matching those with excess of funds to those who do not have an excess (loans)
- Cost of borrowing, incentive of lending
- Prior to 1980, the rate of money growth (change in the money supply) and the interest rate on long-term treasury bonds were closely tied
- Since then, the relationship is less clear, but the rate of money growth is still an important determinant of interest rates
Why Study Financial Institutions and Banking?
- Financial intermediaries: institutions that borrow funds from people who have saved and in turn make loans to people who need funds
- Banks: accept deposits and make loans
- Other financial institutions: insurance companies, finance companies, pension funds, mutual funds, and investment companies
- i.e. any service that you give your money to in exchange for investment
- Financial innovation: the development of new financial products and services
- Improves the economy
- Example: the microloan program that finds startups and gives a small cash loan ($1000) to help the company to start
- Can be an important force for good by making the financial system more efficient
- E-finance: the ability to deliver financial services electronically
- Emails, apps, texts, etc. make it more efficient to do things
- Example: can invest in stocks from your phone
- Emails, apps, texts, etc. make it more efficient to do things
- Improves the economy
- Financial crises: major disruptions in financial markets that are characterized by sharp declines in asset prices and the failures of many financial and nonfinancial firms
- Sudden, sharp declines in prices like the silicon valley bank collapse
Fiscal Policy and Monetary Policy
- Monetary policy is the management of money and interest rates
- Conducted in the United States by the Fed
- Seeing aggregate demand and supply to determine what to do in order to smooth recessions
- Conducted in the United States by the Fed
- Fiscal policy deals with government spending and taxation
- Determining whether or not you will be competing with the government in order to borrow money
- Budget deficit is the excess of expenditures over revenues for a particular year
- Budget surplus is the excess of revenues over expenditures for a particular year
- Any deficit must be financed by borrowing eventually
- The US has been running a deficit for around 40 years
Chapter 2
Function of Financial Intermediaries: Indirect Finance
- Lower transaction costs (time and money spent in carrying out financial transactions)
- Economies of scale: a large factory is more efficient than a small factory
- If you only have the resources to produce a small amount of goods, it can be costly
- If you can produce a specialized large quantity of goods, you can save money but you need a larger intermediary
- Liquidity services
- Economies of scale: a large factory is more efficient than a small factory
- Reduce the exposure of investors to risk
- Risk sharing (asset transformation)
- Not going all in on one asset
- Diversification
- Risk sharing (asset transformation)
- Deal with asymmetric information problems:
- Adverse selection (before the transaction): try to avoid selecting the risky borrower by gathering information about them
- Those who need health insurance the most will be willing to spend a lot of money on their policy → the insurance provider would not want to provide the insurance because they will not make money from that person
- A failing student would want to flip a coin and be able to pass → the professor would not prefer that since the student was failing
- Moral Hazard (after the transaction): ensure borrower will not engage in activities that will prevent one to pay the loan
- Sign a contract with restrictive contents
- Keep up with what the borrower is doing, make sure they are doing what they said they would with the money
- Taking a loan and doing things not in best interest
- Saying you are borrowing for a startup, but instead gambling the money
- Sign a contract with restrictive contents
- Adverse selection (before the transaction): try to avoid selecting the risky borrower by gathering information about them
Chapter 3
- History of Money
- Initially there was a trading and bartering system
- Then we started transitioning to commodity money: goods used as money that also has value independent as their use as money (like animal skins or precious metals)
- Product A ⇌ Currency ⇌ Product B
- The Four Primary Functions of Money
- There are four main properties of money that are important for our studies:
- Medium of exchange → buy things
- Money is acceptable to a wide variety of parties as a form of payment for goods and services
- You go into a store with a $20 bill and know that it will be honored as currency
- Money is acceptable to a wide variety of parties as a form of payment for goods and services
- Unit of account → price tags
- Money allows a way of measuring value in a standard matter
- We assign values to objects by giving them a dollar value (price tag)
- Money allows a way of measuring value in a standard matter
- Store of value → save it
- Money allows people to defer consumption until a later date by storing value. Other assets can do this too, but money does it particularly well because it is liquid
- We can save money over time for larger purchases
- Money allows people to defer consumption until a later date by storing value. Other assets can do this too, but money does it particularly well because it is liquid
- Standard of deferred payment → invest
- Money facilitates exchanges across time when we anticipate that its value in the future will be predictable
- We can use money as a means for borrowing and lending because we know its approximate value in the future
- Which is why Bitcoin is not used for investments since the value fluctuates more
- We can use money as a means for borrowing and lending because we know its approximate value in the future
- Money facilitates exchanges across time when we anticipate that its value in the future will be predictable
- What Can Serve as Money?
- In order to serve as an acceptable medium of exchange (and hence a potential “money”), a good should have the following characteristics:
- The good must be acceptable to most people.
- Something that people want and are willing to carry around
- It should be of standardized quality so any two units are alike.
- Shells had different sizes, impurities, cracks
- It should be durable so the value is not lost by storage.
- So it does not decay or get destroyed in storage
- Helps with everyday use
- It should be valuable relative to its weight, so that it can easily be transported even in large quantities.
- Dollar bills are lighter than coins
- It should be divisible because different goods are valued differently.
- Coins and dollar bills have different values
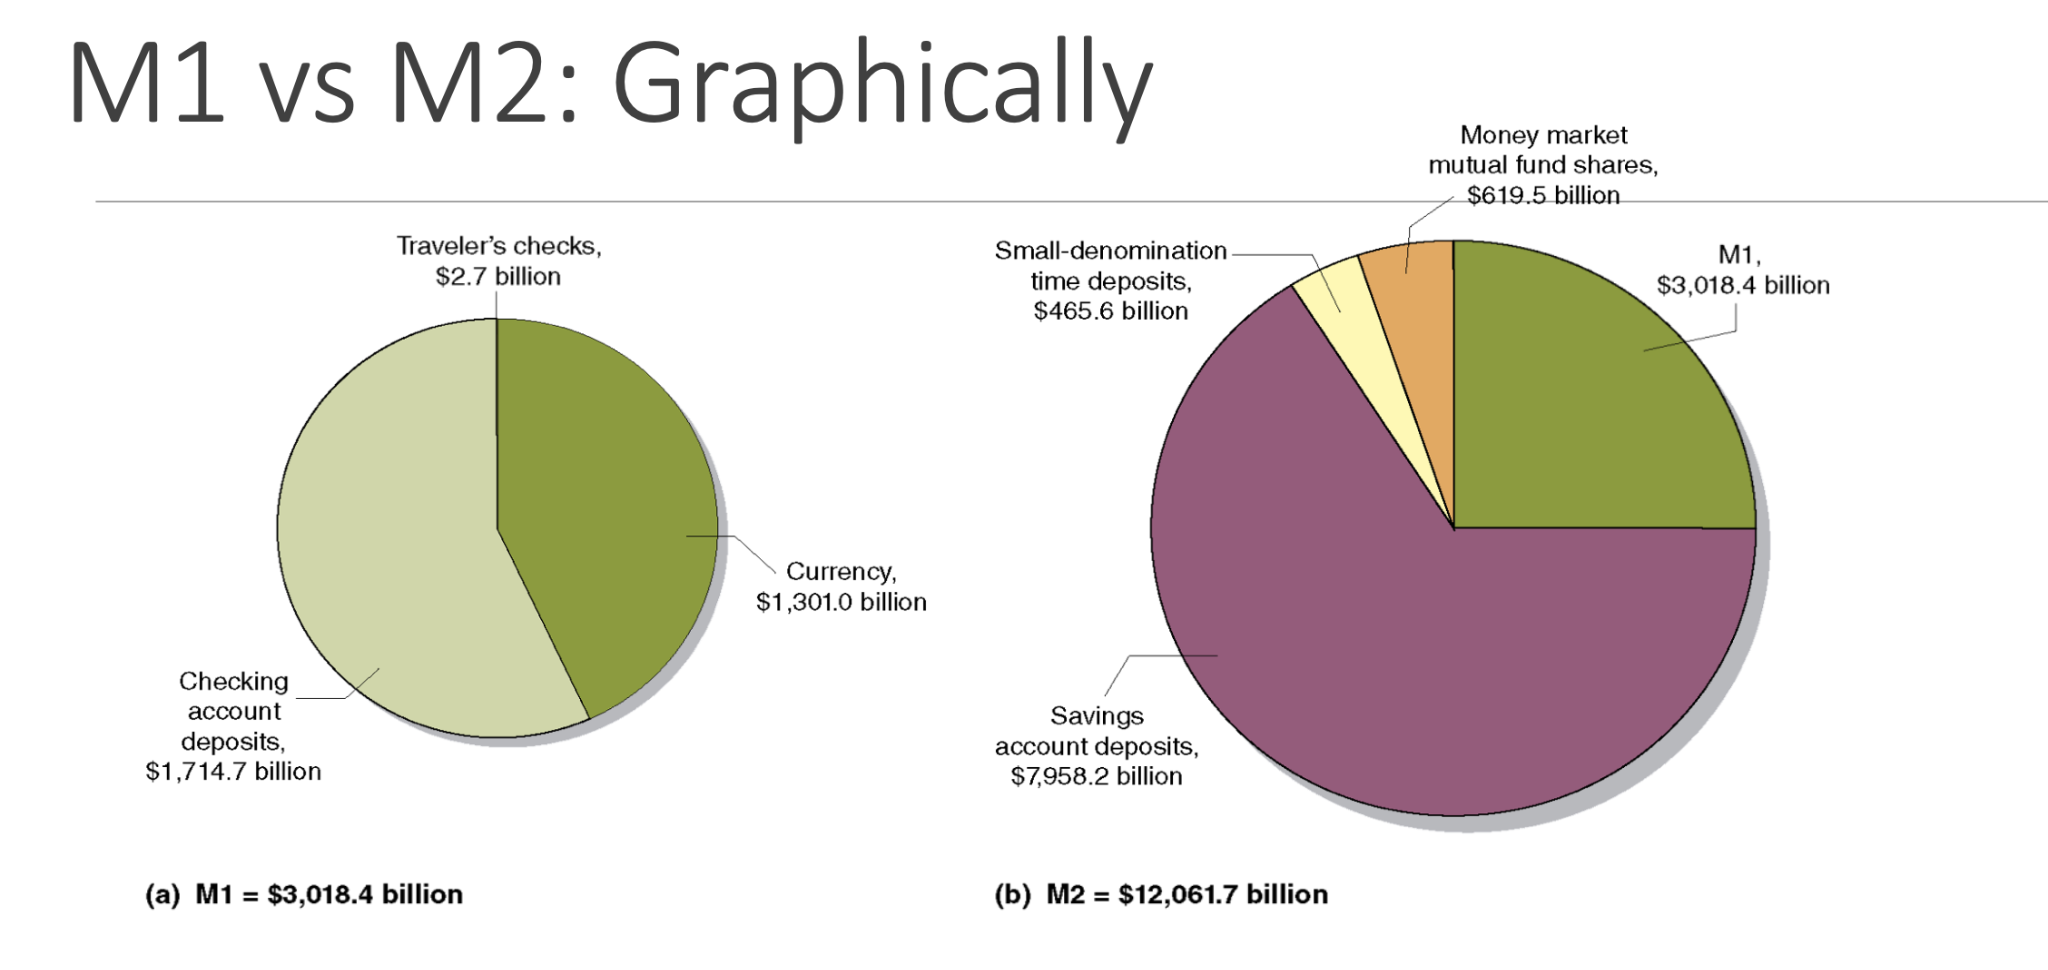
- How is Money Measured in the United States Today?
- ⭐️⭐️⭐️⭐️⭐️There are two key categories to distinguish⭐️⭐️⭐️⭐️⭐️
- “M1” is the narrowest definition of the money supply:
- The sum of currency in circulation
- Checking account deposits in banks
- And holdings of traveler’s checks
- When you travel, you wait until you get to the destination to take out a large amount of money
- “M2” is a broader definition of the money supply, it includes
- M1
- All of M1 is included in M2, but not all of M2 is included in M1
- Savings account deposits
- This course will consider it M2 not M1
- Small-denomination time deposits
- Balances in money market deposit accounts
- Non Institutional money market fund shares
- M1
- “M1” is the narrowest definition of the money supply:
- ⭐️⭐️⭐️⭐️⭐️There are two key categories to distinguish⭐️⭐️⭐️⭐️⭐️
Chapter 13
- The Establishment of the Federal Reserve System
- The Charter of the Second Bank of the U.S. expires in 1836.
- Resistance to the establishment of a central bank
- Fear of centralized power
- Distrust of moneyed interests
- Resistance to the establishment of a central bank
- No lender of last resort
- Lender of last resort is like a “bank for banks,” where there is a central bank for banks to use when there was not enough money for withdrawals for the next day
- Nationwide bank panics on a regular basis
- Panic of 1907 so severe that the public was convinced a central bank was needed
- The Charter of the Second Bank of the U.S. expires in 1836.
- The Feedback Loop During a Bank Panic

- The figure shows how a bank panic can take place.
- Central Banks, like the Federal Reserve, can help to prevent bank runs and panics by acting as a lender of last resort, promising to make loans to banks in order to pay off depositors
- Short term loans for the banks to have the money to give for deposits
- Worst case scenario option
- Opens up investigation with the central bank as to why there was not enough money
- Worst case scenario option
- In the “Bank Run” stage
- Short term loans for the banks to have the money to give for deposits
- The Establishment of the Federal Reserve System
- In the late nineteenth and early twentieth centuries, the United States experienced several bank panics.
- In 1914, the Federal Reserve system started. “The Fed” makes loans to banks called discount loans, charging a rate of interest called the discount rate
- During the Great Depression of the 1930s, many banks were hit by bank runs. Afraid of encouraging bad banking practices, the Fed refused to make discount loans to many banks, and more than 5000 banks failed
- There were issues about where the money for loans will come from
- In the late nineteenth and early twentieth centuries, the United States experienced several bank panics.
- Response to the Great Depression
- In 1934, Congress established the Federal Deposit Insurance Corporation (FDIC)
- The FDIC insures deposits in many banks, up to a limit (currently $250,000). This government guarantee has helped to limit bank panics
- You know the money will always come back, even in absolute worse case scenarios the money will come back from the central bank
- The FDIC insures deposits in many banks, up to a limit (currently $250,000). This government guarantee has helped to limit bank panics
- Bank runs are still possible; during the recession of 2007-2009, a few banks experienced runs from large depositors whose deposits exceeded the FDIC limit
- In 1934, Congress established the Federal Deposit Insurance Corporation (FDIC)
- The Federal Reserve System
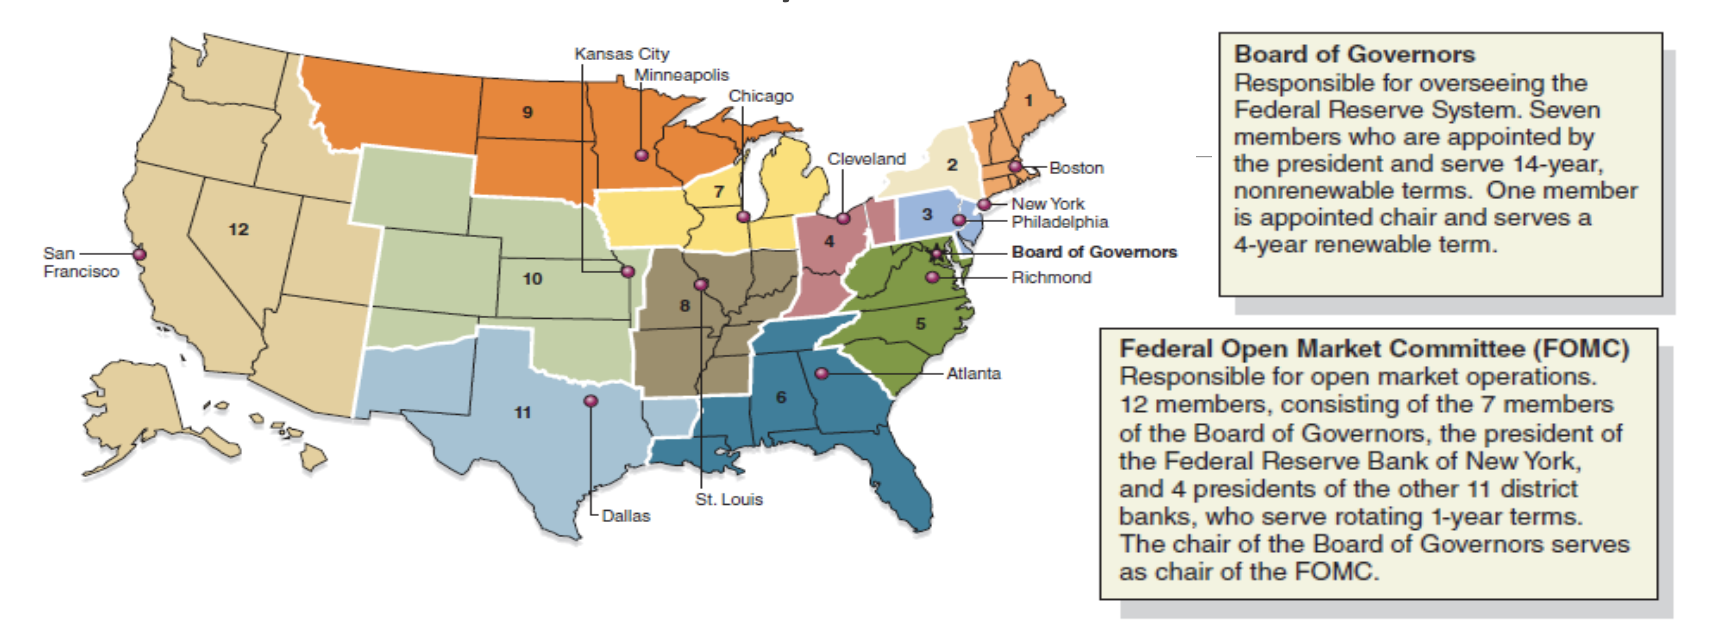
- In 1913, Congress divided the country into 12 Federal Reserve districts, each of which provides services to banks in the district
- But the real power of the Fed lies in Washington DC, with the Board of Governors
- The current chair of the Board of Governors is Jerome Powell
- Role of Federal Reserve Banks
- Clear checks
- Issue new currency
- Or order the mint to make more
- Withdraw damaged currency from circulation
- Administer and make discount loans to banks in their districts
- As a resource to use before having to go to the central bank
- Evaluate proposed mergers and applications for banks to expand their activities
- Federal Reserve Banks: Districts
- Each district is run by 9 directors
- 3 professional bankers
- Elected by member banks
- 3 industry leaders
- Elected by member banks
- 3 appointees from Board
- 3 professional bankers
- All 12 districts have their own president as well
- Each district is run by 9 directors
- The Federal Reserve System
- The Fed is also responsible for managing the money supply.
- The Federal Open Market Committee (FOMC) conducts America’s monetary policy: the actions the Federal Reserve takes to manage the money supply and interest rates to pursue macroeconomic policy objectives
- Buy or sells treasury bonds to increase or decrease the amount of money in circulation
- Federal Funds Rate vs. Discount Rate
- All official banks must adhere to reserve requirements sent by the Fed. This means at the end of the day they must have a certain percentage of assets as deposits for potential withdrawals in the future.
- You have to keep a percentage of total money in order to be able to give withdrawals the next day
- Set by the Board of Govs.
- Federal Funds Rate: the rate for a bank to borrow overnight from other banks with surplus funds
- Typically a scale
- Set by the FOMC
- Discount Rate: the rate for borrowing from the U.S. Central Bank, normally as a last resort. Typically higher than the FFR.
- A locked in percentage
- Set by the Board of Govs.
- All official banks must adhere to reserve requirements sent by the Fed. This means at the end of the day they must have a certain percentage of assets as deposits for potential withdrawals in the future.
- Why the Chair really runs the show:
- Spokesperson for the Fed and negotiates with Congress and the President
- Sets the agenda for meetings
- Speaks and votes first about monetary policy
- Before the Board of Governors gets to vote
- Can sway their votes
- Before the Board of Governors gets to vote
- Supervises professional economists and advisers
- How Independent is the Fed?
- Instrument and goal independence
- Instrument independence means the Fed can use the tools it wants to use
- Goal independence means the Fed can use the target it wants to use
- Independent revenue
- Fed’s structure is written by Congress and is subject to change at any time
- Presidential influence
- Instrument and goal independence
- Influence on Congress
- Appoints members
- Appoints chairman although terms are not concurrent.
- Should the Fed be Independent?
- The Case for Independence
- The strongest argument for an independent central bank rests on the view that subjecting it to more political pressures would impart an inflationary bias to monetary policy
- To link the money supply to political candidates → inflate money before elections so people feel richer and are inclined to vote
- Prevents misuse (politically)
- The strongest argument for an independent central bank rests on the view that subjecting it to more political pressures would impart an inflationary bias to monetary policy
- The Case Against Independence
- Proponents of a Fed under control of the president or Congress argue that it is undemocratic to have monetary policy (which affects almost everyone in the economy) controlled by an elite group that is responsible to no one
- Miscommunication between the two
- Proponents of a Fed under control of the president or Congress argue that it is undemocratic to have monetary policy (which affects almost everyone in the economy) controlled by an elite group that is responsible to no one
- The Case for Independence
Chapter 14
- The Fed’s Balance Sheet
Federal Reserve System | |
|---|---|
Assets | Liabilities |
Securities | Currency in circulation |
Loans to financial institutions | reserves |
- Liabilities
- Currency in circulation: in the hands of the public
- All currency in circulation needs to have value in order to enforce
- Reserves: bank deposits at the Fed and fault cash
- Reserves are bank accounts
- Currency in circulation: in the hands of the public
- Assets
- Government securities: holdings by the Fed that affect money supply and earn interest
- Discount loans: provide reserves to banks and earn the discount rate
- Control of the Monetary Base
- The Monetary Base is equal to the total currency in circulation and the total reserves in the banking system
- It can be expressed as an equation:
MB = C + R
- MB is monetary base
- Amount of money there is, amount of money in banks
- C is currency
- R is total reserve
- Open Market Purchase from a Bank
Banking System | ||
|---|---|---|
Assets | Liabilities | |
Securities | -$100M | |
Reserves | +$100M |
Federal Reserve | System | ||
|---|---|---|---|
Assets | Liabilities | ||
Securities | +$100M | Reserves | +$100M |
- Open Market Purchase: the Fed purchases bonds/securities in the open market
- Open Market Purchase from Nonbank Public
Banking System | ||
|---|---|---|
Assets | Liabilities | |
Reserves | +$100M | Checkable deposits |
Federal Reserve | System | ||
|---|---|---|---|
Assets | Liabilities | ||
Securities | +$100M | Reserves | -$100M |
- Suppose this time the Fed purchases securities from the nonbank public. Then one of two things happens.
- Doesn't matter where the money comes from
- Everytime you deposit money it is a liability because you can ask for the money back
- Open Market Purchase from Nonbank Public
Nonbank Public | |||
|---|---|---|---|
Assets | Liabilities | ||
Securities | -$100M | ||
Currency | +$100M |
Federal Reserve | System | ||
|---|---|---|---|
Assets | Liabilities | ||
Securities | +$100M | Currency in circulation | +$100M |
- Can the Fed Control the Monetary Base?
- While open market operation are controlled by the Fed, they cannot determine the amount of borrowing by banks from the Fed
- Therefore, we split the monetary base into two components:
- While open market operation are controlled by the Fed, they cannot determine the amount of borrowing by banks from the Fed
MBn = MB - BR
- MBn is the nonborrowed monetary base the remainder of the monetary base minus and borrowings (BR) from the Fed
- As MB increases (say from open market operations), so does MBn
- What Exactly are “Nonborrowed Reserves”?
- “Nonborrowed reserves” are funds a financial institution holds in cash; the funds are its own, and not money on loan from a central bank
- In practice, the vast majority of U.S. reserves are non-borrowed; getting loans from the Fed is relatively expensive
- A bank’s non-borrowed reserves overlap with, but are not exactly the same as, its excess reserves or free reserves
- Excess reserves refer to any reserves a bank has that exceed the Fed’s reserves requirements, whether they are borrowed or not
- “Nonborrowed reserves” are funds a financial institution holds in cash; the funds are its own, and not money on loan from a central bank
- What Impacts the Money Supply?
- Changes in the nonborrowed monetary base
- Positively related
- More money in circulation increases the money supply itself
- Positively related
- Changes in the borrowed reserves from the Fed (BR)
- Positively related
- If you borrow more money from the federal reserve, you increase the amount of money that is available in circulating through the economy
- Positively related
- Changes in the required reserves ratio (RRR):
- Negatively related: when RRR increases, money supply decreases
- Changes in excess reserves
- Negatively related
- Any time there is a potential recession, the bank can hold on to excess reserves as an insurance against bankruptcy
- The federal reserve pays interest on excess reserves
- Negatively related
- Changes in currency holdings
- Negatively related
- Withdrawing and holding money in cash prevents banks from using that money for loans
- Increasing personal cash supply decreases the money supply
- Withdrawing and holding money in cash prevents banks from using that money for loans
- Negatively related
- Changes in the nonborrowed monetary base
Chapter 15
- Open Market Operations:
- Dynamic open market operations: intended to directly change the level of reserves and the monetary base
- Defensive open market operations: intended to maintain levels and offset other factors that affect reserve and the monetary base
- Tries to smooth out peaks and troughs over time in the short term
- Repurchase agreements (repos): the seller agrees to purchase back the security from the Fed in a short time (1-15 days)
- When the cash supply is low, I am going to buy an asset, but once money stabilizes, the asset is bought back
- Matched sale-purchase agreements: the buyer agrees to sell back the security to the Fed after a short time
- Discount Policy and Lender of Last Resort:
- Primary credit: the Standing Lending Facility which allows banks to borrow all they want from the Fed with a very short maturity (typically overnight)
- Makes the federal reserve money
- Ok
- Secondary credit: loans available for banks that are in financial trouble with severe liquidity problems. Typically slightly higher (0.5%) interest rates than primary
- Bad
- Seasonal credit: for banks with high seasonality (vacation destinations, agricultural areas)
- Long term loans are given during off-season
- Good
- Primary credit: the Standing Lending Facility which allows banks to borrow all they want from the Fed with a very short maturity (typically overnight)
- Reserve Requirements
- The Depository Institutions Deregulation and Monetary Control Act (DIDMCA) of 1980 set the reserve requirement the same for all depository institutions.
- 10% checkable deposit over $115 million
- The Fed can change this from between 8-4%
- 10% checkable deposit over $115 million
- The Depository Institutions Deregulation and Monetary Control Act (DIDMCA) of 1980 set the reserve requirement the same for all depository institutions.
- Excess Reserves and their Interest
The Fed only started paying interest on excess reserves only in 2008
- The interest-on-excess-reserves tool came to the rescue during the crash as banks were accumulating huge quantities of excess because it can be used to effectively raise the federal funds rate.
- Relative Advantages of the Different Tools
- Open market operations are the dominant policy tool of the Fed since it has complete control over the volume of transactions, these operations are flexible and precise, easily reversed, and can be quickly implemented.
- The discount rate is less used since it is no longer binding for most banks, can cause liquidity problems, and increases uncertainty for banks. The discount window remains of tremendous value given its ability to allow the Fed to act as a lender of last resort.
Chapter 20
- Roadmap:
- Where we are:
- “Who conducts monetary policy, what tools do they have, and why do we need these tools?”
- Where we are now:
- “How does the interest rate impact the economy’s production?” The IS Curve
- Where we are headed:
- “How does monetary policy impact the economy’s production?” The MP Curve
- Where we are:
- Planned Expenditure
- Planned Expenditure: the total amount that households, businesses, the government, and foreign people spend on domestically produced goods and services
- This is also called Aggregate Demand, which can be written as the sum of four types of spending
- Why do you buy what you buy, and how can I impact that?
YAD = C + I + G + NX
- Consumption Expenditure
- Consumption: “the total demand for consumer goods and services”
- What households buy and consume
- What impacts how much YOU spend on goods?
- Your income → Y
- Your taxes/tax rates → T
- (Y - T) = YD
- YD = Y - T
- Disposable income = income - taxes
- (Y - T) = YD
- How much you put in savings → mpc
- mpc = marginal propensity to consume
- What percent of every dollar I get do I consume?
- A number between [0 - 1]
- mpc = marginal propensity to consume
- Consumption: “the total demand for consumer goods and services”

- Autonomous Consumption
- There is some level of consumption that people do no matter how big/small their disposable income is
- Autonomous Consumption: the amount of consumption expenditure that is exogenous (not affected by other variables in the model)
- Occurs no matter what, no matter what your income is you still spend some money
- Therefore:
C = /C/ + (mpc * YD)
- Investment Spending
- Investment: “The purchase of new physical assets that add to aggregate demand”
- Suppose a company is considering expanding into a new location by the venture would cost 100 million dollars. What might impact if they invest and take out a loan?
- Interest rate on the loan → ri
- Expected increase in revenue
- Increase in income
- Current feeling about the economy → /I/
- “The vibe check of the economy”
- If there is a recession, you will not want to invest
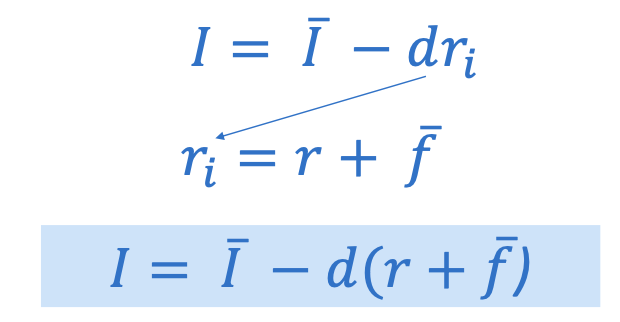
- Investment Function
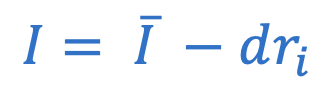
- Planned investment is impacted by the autonomous investment (fluctuations in investing from waves of optimism and pessimism), the interest rate, and “d” which is the responsiveness of investment to the interest rate
- However:
- The interest rate is also affected by “financial frictions” which are not controlled by the Fed. these are essentially added costs to borrowing that come from asymmetric information about the creditworthiness of someone
- Corporation banks are not allowed to borrow from the federal reserves
- The federal reserve do not directly impact interest rates
- Government Purchases and Taxes
- Government purchases: “spending by all governments on goods and services (not counting transfer payments)”
YAD = C + I + G + NX
- The government affected aggregate demand directly through government purchases, G. For now, we assume
- G = /G/
- We also saw that taxes, T, play a role in consumption through disposable income. We also will assume that
- T = /T/
- The government affected aggregate demand directly through government purchases, G. For now, we assume
- Net Exports
- Net Exports: “the net foreign spending on domestic goods and services. [exports minus imports]
- Net exports between countries are affected by changes in the exchange rate between currencies. The exchange rate, however, is impacted directly by the interest rate of any economy
- For example:
- If the U.S. interest rates rise, dollar assets earn more compared to foreign assets. More people want to hold U.S. dollars so they bid up the price leading to a higher value of the dollar.
- interest rate affects demand for U.S. currency which affects demand for exports which affects net exports
- An increase in the value of the dollar makes U.S. exports “more expensive” so foreign nations buy less exports
- Net exports decreases
- If the U.S. interest rates rise, dollar assets earn more compared to foreign assets. More people want to hold U.S. dollars so they bid up the price leading to a higher value of the dollar.
- For example:
- Net Exports Function

- /NX/ is the level of net exports not impacted by our interest rate (exogenous)
- Can be affected by other things
- x is how net exports respond to changes in interest rates
- The higher the interest rate, the lower the net exports
- r is the short term interest rate controlled by the central bank
- Putting it all together…

- So What Does This Mean?

- Aggregate Demand or Planned Expenditure (Y) will increase if there’s an increase in:
- Autonomous consumption, /C/
- Autonomous investment, /I/
- Government purchases, /G/
- Autonomous net exports, /NX/
- If something occurs to cause these to increase or decrease, the GDP will respond
- Aggregate Demand or Planned Expenditure will decrease if there’s an increase in:
- Taxes, /T/
- As taxes increase in an economy, citizens will have less money to spend
- Financial frictions, /f/
- Makes it more costly for firms to invest, and in turn they invest less
- Taxes, /T/
- It’s all about the sign (+ or -) in front of the variable
- The IS Curve
- The last part of our IS Curve equation shows that as the real interest rate increases, the aggregate output decreases
- This is because of the minus sign in front of the term
- Therefore, the IS Curve slopes downward
- This is because of the minus sign in front of the term
- The last part of our IS Curve equation shows that as the real interest rate increases, the aggregate output decreases
![]()
- Aside: Shift vs. Slide
- When translating changes in the economy into changes in graphs, you might want to be careful in distinguishing between a SHIFT in the curve (to the left, right, etc.) or a SLIDE along the curve
- To remember this, there’s a general rule of thumb:
- When translating changes in the economy into changes in graphs, you might want to be careful in distinguishing between a SHIFT in the curve (to the left, right, etc.) or a SLIDE along the curve
- Is it a change in one of the axis variables? If so, it’s a SLIDE along the curve
- Is it a change in one of the non-axis variables? If so, it’s a SHIFT along the curve
- The IS Curve
- Why does this line represent “equilibrium”?
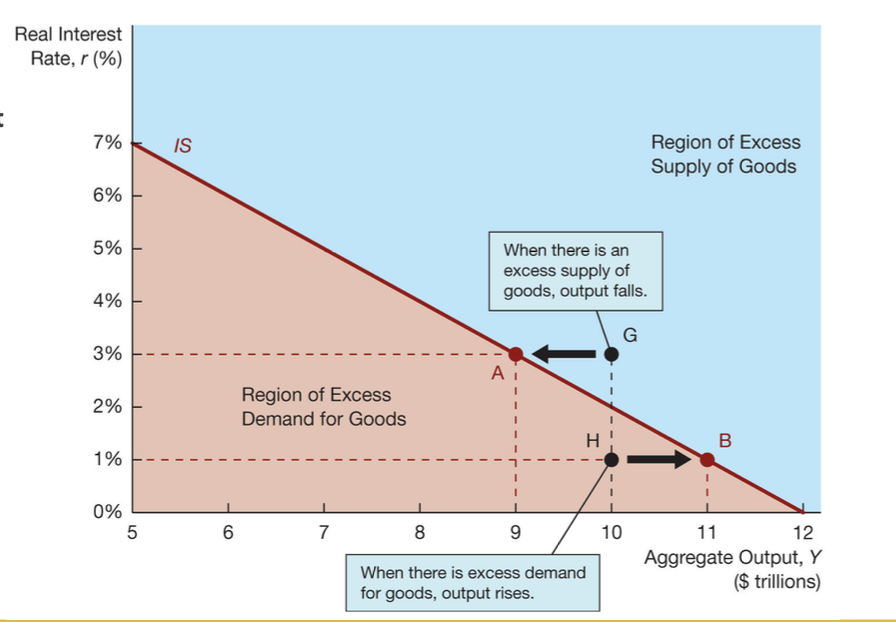
- At point G there is an excess supply (Aggregate Output) compared to Aggregate Demand
- Firms will decrease production
- At point H there is an excess demand for goods
- Firms will increase their production
- A Change in Government Purchases
- Identify the change
- What variable?
- Shift?
- Illustrate
- Suppose there is an increase in government purchases (/G/).
- What would happen to the IS curve?
- /G/ increasing directly causes aggregate demand to increase, no matter the interest rate
- As government increases, total spending increases because government purchases is apart of total spending
- The IS curve would shift to the right to reflect an increase in aggregate output
- /G/ increasing directly causes aggregate demand to increase, no matter the interest rate
- What would happen to the IS curve?
- Suppose there is an increase in government purchases (/G/).
- A Change in Taxes
- Suppose there is an increase in taxes (/T/).
- What would happen to the IS curve?
- /T/ increasing causes consumption to decrease because we would have less disposable income available
- Consumption decreasing causes the IS curve to shift to the left to reflect a decrease in aggregate output
- What would happen to the IS curve?
- Suppose there is an increase in taxes (/T/).
- Left = decrease, right = increase
- Shifts from Autonomous Changes
Chapter 21
- The Federal Reserve and Monetary Policy
- The Fed of the United States can conduct monetary policy by setting the federal funds rate— the interest rate at which banks lend to each other.
- When the Federal Reserve lowers the federal funds rate, real interest rates fall
- When the Federal Reserve raises the federal funds rate, real interest rates rise
- The Fed of the United States can conduct monetary policy by setting the federal funds rate— the interest rate at which banks lend to each other.
- The Monetary Policy (MP) Curve
- The monetary policy (MP) curve shows how monetary policy, measured by the real interest rate, reacts to the:
- inflation rate, 𝜋
- The monetary policy (MP) curve shows how monetary policy, measured by the real interest rate, reacts to the:
r = /r/+λ𝜋
Where /r/ = autonomous component of r
λ = responsiveness of r to inflation
- The MP curve is upward sloping:
- When the inflation rate rises, the Federal Reserve increases the interest rate
- The MP curve is upward sloping:
- Why Does the MP Curve Slope Upward?
- One of the key goals of the Federal Reserve (and most central banks) is to keep inflation stable. When our economy is growing and expanding quickly, prices tend to increase as consumers and investors demand more
- John B. Taylor proposed the Taylor Principle.
- Taylor Principle: to stabilize the economy, the central bank should increase the interest rate to combat inflation. This often means increasing the interest rate MORE than the amount that inflation increased
- Makes it too costly to invest, which makes less disposable income
- Sliding to a lower point in spending and a lower amount of production overall
- Decreases inflation over time
- Makes it too costly to invest, which makes less disposable income
- Taylor Principle: to stabilize the economy, the central bank should increase the interest rate to combat inflation. This often means increasing the interest rate MORE than the amount that inflation increased
- Let’s rethink how we measure the “true cost” of borrowing funds.
r = i - 𝜋e
- r is the real interest rate
- i is the nominal interest rate
- 𝜋e is the expected inflation rate
- As the inflation rate increases, the value of money in the future decreases. So the “true cost” of borrowing would increase
- To combat this, the Federal Reserve would needs to make up for changes in inflation AND increases the interest rate (to drive down the expansion)
- The federal reserve can increase interest rates to cancel out changes in inflation
- Increase interest rates by a larger percentage
- Do not match 1:1 because it will not stop inflation rate from continuing to increase
- The federal reserve can increase interest rates to cancel out changes in inflation
- To combat this, the Federal Reserve would needs to make up for changes in inflation AND increases the interest rate (to drive down the expansion)
- We can imagine a scenario where the following happens:
- 1) There is inflation in the economy as prices start to increase.
- 2) Households find that it is more expensive for them to make the same purchases they normally do. Therefore they need more money today to keep their consumption stable
- Need $75 one week for groceries, then need $80 the next week
- 3) Consumers decide to move money out of savings/investments in order to afford the increases prices for goods and services
- Or put less money into savings/investments
- 4) Lenders find the demand for loans/investments has decreased so to attract buyers they have to offer higher interest rates
- Savings decreases and banks have to offer incentive
- Supply of loanable funds decreases
- Shifts in the MP Curve

- The Fed may change monetary policy for reasons other than changes in the inflation rate following the Taylor Principle. These would affect 𝑟̅ and are considered autonomous changes
- Autonomous Tightening of Monetary Policy: increasing /r/ to increase the interest rate for any given inflation rate
- Increasing inflation rate slows down the economy
- When r increases, total spending goes down and the economy cools off
- Autonomous Easing of Monetary Policy: decreasing /r/ to decrease the interest rate for any given inflation rate
- Autonomous Tightening of Monetary Policy: increasing /r/ to increase the interest rate for any given inflation rate
- Comparing the Curves
- Up to this point we have seen:
- The Investment-Savings (IS) Curve: illustrates the relationship between the real interest rate and aggregate output when investment = savings in equilibrium. Slopes downward
- The Monetary Policy (MP) Curve: illustrates the relationship between interest rate set by the Fed and the inflation rate. Slopes upward
- Now we want to connect the concepts and create the Aggregate Demand Curve: the relationship between the inflation rate and aggregate output
- “Relabeling the IS curve”
- Prices not in this, prices cannot go down they just grow slower
- We care more about inflation than price level
- Up to this point we have seen:
- Connecting the Curves


- What Shifts in the AD Curve? (IS)
- Since both the IS curve and AD curve are downward sloping with the same x-axis
- Anything that would directly shift the IS curve will shift the AD curve in the same direction
- Since both the IS curve and AD curve are downward sloping with the same x-axis

- What Shifts the AD curve? (MP)

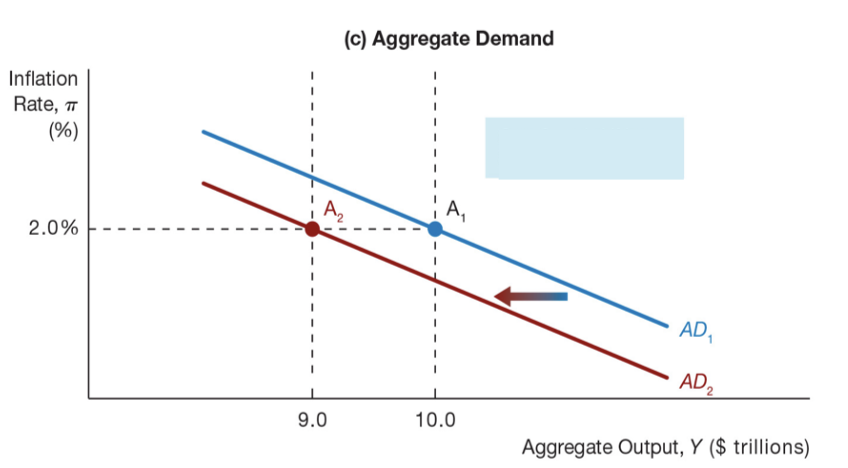
- Autonomous monetary policy tightening increases the real interest rate, causing movement along the IS curve, decreasing equilibrium output, and shifting the AD curve leftward
- If the MP curve shifts left, the AD curve shifts to the left
Chapter 22
- Aggregate Supply Curves
- Aggregate Supply Curve: shows the relationship between the quantity of goods supplied and the inflation rate
- Since prices and wages typically take time to fully adjust to reflect changes in costs, the aggregate supply curve behaves different in the short-run vs. the long-run.
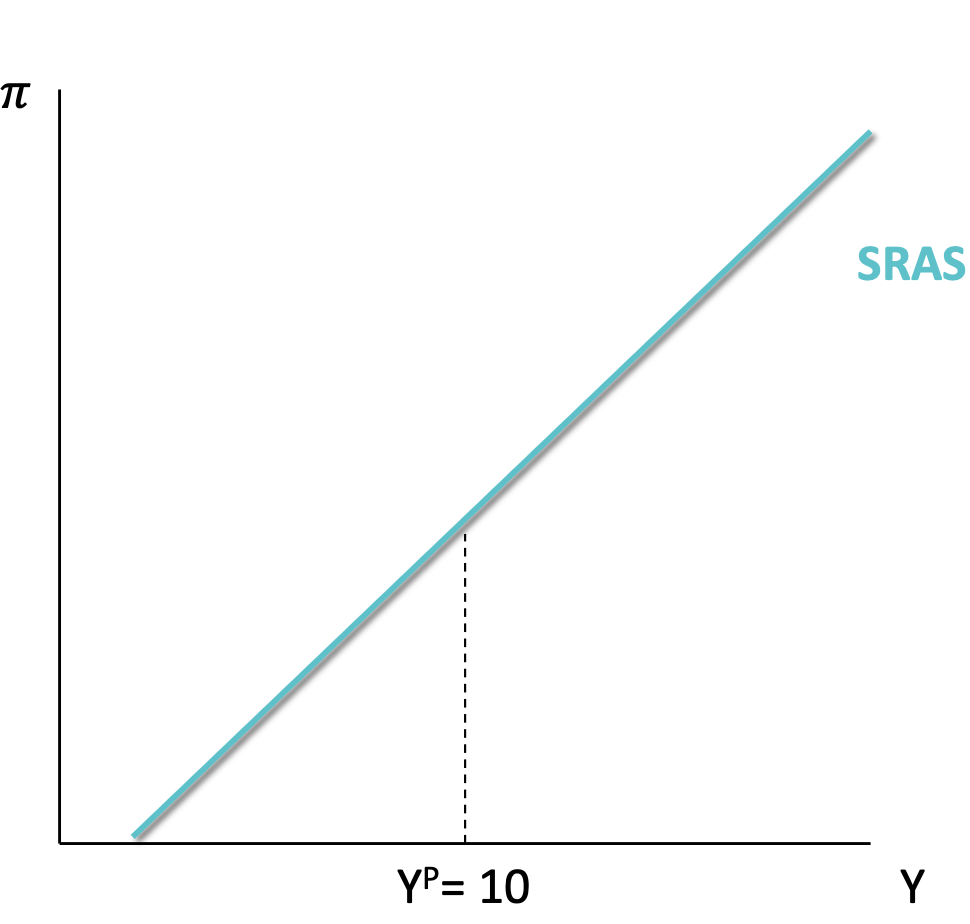
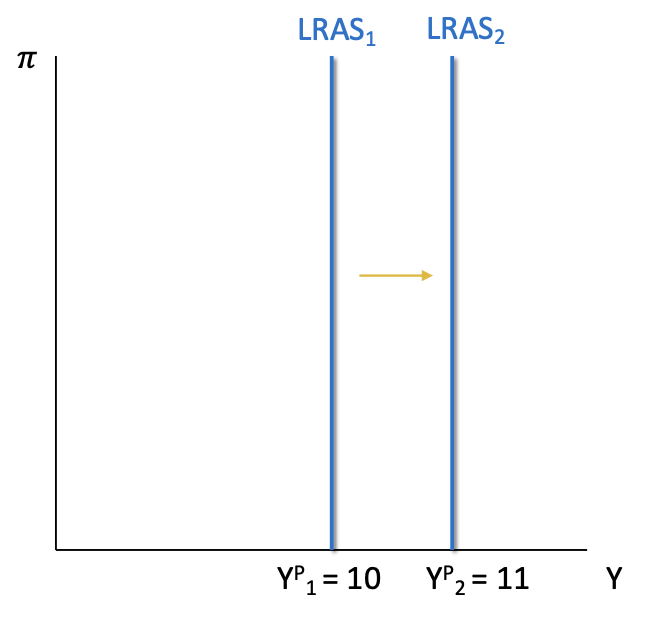
- Long Run Aggregate Supply (LRAS): determined by the amount of capital, technology, and labor from full employment in an economy. Vertical line.
- Short Run Aggregate Supply (SRAS): determined by expectations of inflation, the output gap (expansion/recession), and supply shocks. Upward sloping.
- Aggregate Supply Curve: shows the relationship between the quantity of goods supplied and the inflation rate
- Long Run Aggregate Supply
- The long run output if an economy is determined by
- Number of workers in full employment
- Natural rate of unemployment: the level of unemployment when cyclical unemployment is zero (the only people unemployed are frictional or structural)
- Typically thought to be around 4% of USA
- Amount of capital available to workers
- Amount of tools, assistance
- Quantity and quality of technology available to workers
- Higher quality tools leads to more production
- Number of workers in full employment
- This level of aggregate output is called potential output or YP
- The long run output if an economy is determined by

- Short-Run Aggregate Supply
- The short run output supplied in economy is determined by
- Expected inflation, 𝜋e
- As workers expect inflation, they demand higher wages
- Alternatively, as firms expect their costs of production to increase in the future, they may increase prices earlier
- The Output Gap (the Business Cycle)
- Output gap: percent difference between current aggregate output and potential output
- Supply shocks
- Energy price shocks, import price shocks, cost-push shocks, etc.
- Expected inflation, 𝜋e
- The short run output supplied in economy is determined by
- Shifts in the Long-Run Aggregate Supply
- Any change in one of the determinants of Long-Run Aggregate Supply will shift the LRAS curve. Each of the following would shift the LRAS curve to the right, regardless of inflation level
- An increase in capital per worker
- An increase in technology
- A decrease in the natural rate of unemployment
- An increase in the number of workers at full employment
- The opposite of each will shift the curve left
- Any change in one of the determinants of Long-Run Aggregate Supply will shift the LRAS curve. Each of the following would shift the LRAS curve to the right, regardless of inflation level
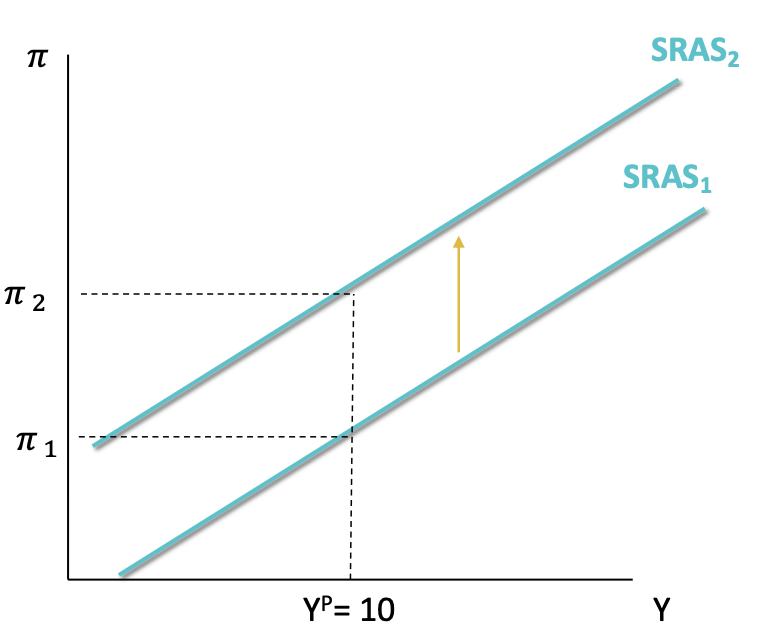
- Shifts in Short-Run Aggregate Supply

- ρ = supply shocks
- Inflation and output move together, hence upward sloping
- Any change in one of the determinants of SRAS will shift the curve. Each of the following would shift the curve up or to the left
- Increase in expected inflation, 𝜋e
- Firms and workers will want to raise wages and prices by the new change in expected inflation (as 𝜋 increases, SRAS shifts up)
- Positive supply shocks
- Prices have gone up
- Persistent positive output gap
- When the output gap is positive, there is very little slack in the economy. Workers demand higher wages, firms increase prices
- Increase in expected inflation, 𝜋e
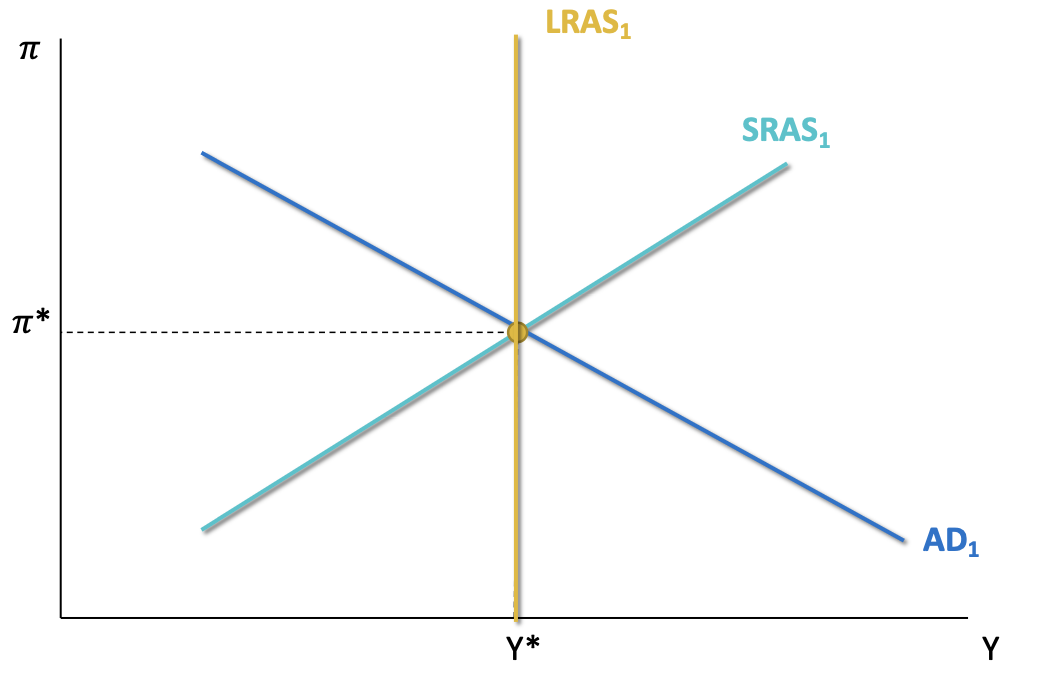
- Graphical Equilibrium
- Where the SRAS and AD curves intersect, we call it short-run macroeconomic equilibrium: the point where aggregate output demanded equals aggregate output supplied.
- It is considered long-run macroeconomic equilibrium if SRAS, AD, and LRAS all intersect at the same pint
- When looking at shifts from equilibrium, we need to distinguish between the effects in the short-run versus the long-run
- Short-Run Shift from Equilibrium (Ex. 1)
- Suppose we were in short-run equilibrium (Y* , 𝜋*) when the government decided to increase government spending. How would this affect output and inflation in the short-run?
- Identify what is changing
- Increase in government spending → government spending increasing
- How does this impact the curves?
- Government spending causes AD to shift to the right
- Illustrate
- Intersection
- Short-Run Shift from Equilibrium (Ex. 2)
- Suppose we were in short-run equilibrium (Y* , 𝜋*) when there is an increase in expected inflation for next year. What happens to output and inflation in the short- run?
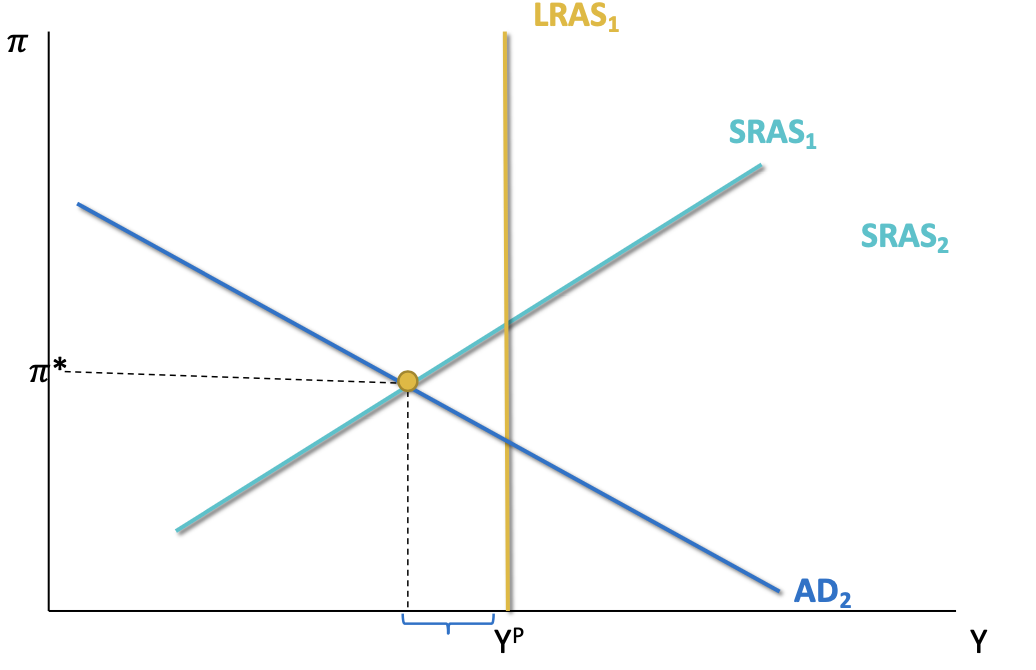
- What About the Long-Run?
- When the economy shifts from equilibrium in the short-run, it creates a gap between actual aggregate output and potential output.
- However... a persistent output gap will affect (shift) the SRAS curve over time
- If actual output is less than potential, unemployment is about the natural rate
- This excessive “slack” in the labor market decreases wages and decreases expectations of future inflation
- This shifts the SRAS curve down/right over time as employers adjust and increase production
- If actual output is less than potential, unemployment is about the natural rate
- Short-Run and Long-Run Effects
- Suppose we were in equilibrium (Y* , 𝜋*) when the government decided to increase spending. How would this affect output and inflation in the short-run and long- run?
- We saw that in the short-run both output and inflation increased.
- Suppose we were in equilibrium (Y* , 𝜋*) when the government decided to increase spending. How would this affect output and inflation in the short-run and long- run?
- Identify what has changed.
- Increase in the output gap.
- How does this impact the economy?
- SRAS shifts left/up over time.
- Illustrate the shift.
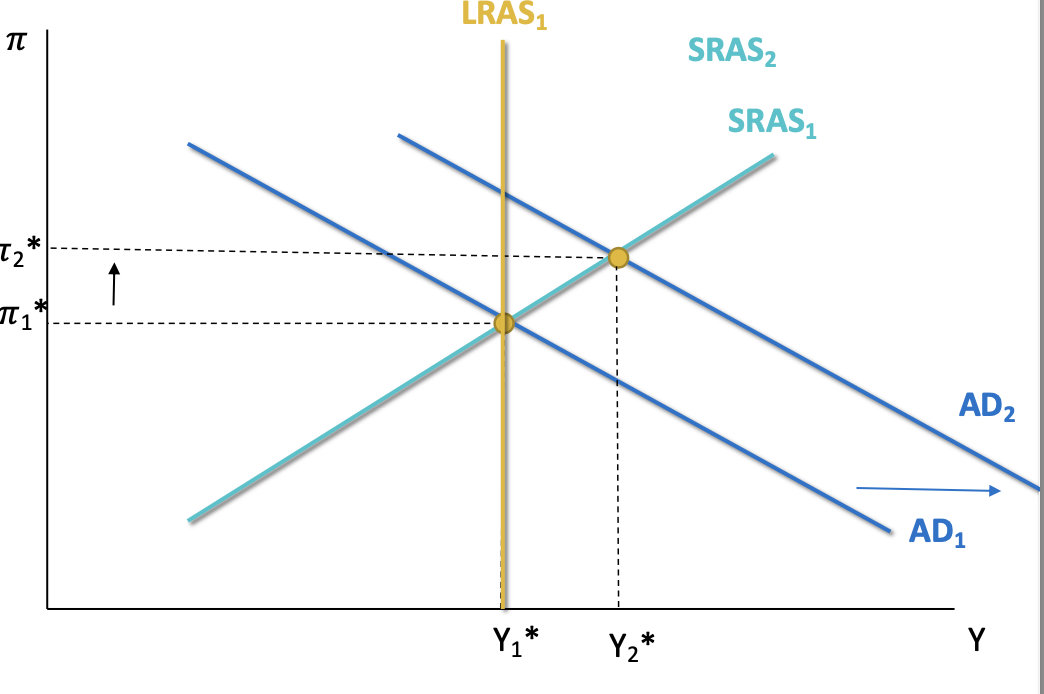
- Calculate new Y* and 𝜋*.
- In the long-run, there was no change in output and increase in inflation
Chapter 23
- Without Monetary Policy
- Up to this point, we have looked at how the economy responds to shocks without response from the Fed
- Take the following example:
- Suppose the government decides to increase taxes. How do output and inflation change in both the short- run and the long-run?
- In the short run, both output and inflation decrease
- In the long run, SRAS shifts to the right. This means there was no change in output but a large decrease in inflation
- Suppose the government decides to increase taxes. How do output and inflation change in both the short- run and the long-run?
- The Goals of the Fed
- The Federal Reserve aims for
- Price stability: maintain constant, slight inflation (1-3%). Typically measured as the “inflation gap” or inflation-inflation target
- Stable economic activity: operate near full employment
- When there is a shock in the economy, it typically shifts us from optimal inflation and/or output
- While we return to potential output in the long-run, we want to return to equilibrium quicker. To do so, we can use monetary policy to impact the economy
- The Federal Reserve aims for
- Monetary Easing After a Demand Shock
- Let’s return to our previous example. Suppose the government decides to increase taxes.
- This would lead to lower output and lower inflation in the short run
- However, the Federal Reserve could enact a monetary policy to counteract this shift. To shift the economy back to normal, they could enact autonomous quantitative easing /r/
- Policy will always shift aggregate demand
- What has changed?
- Interest rate decreases
- /r/ decreases
- How does this shift the curves?
- AD shifts right
- What has changed?
- Let’s return to our previous example. Suppose the government decides to increase taxes.
- Quantitative easing after a negative demand shock shifts the economy back into equilibrium. No change to inflation or output!
- Monetary Policy After a Supply Shock
- Suppose we were in equilibrium (Y*, 𝜋*) when there is an increase in expected
- inflation for next year.
- Output decreases and inflation increases in the short-run. In the long-run (without policy), SRAS would shift back to SRAS1
- Just as before, the Fed can enact autonomous monetary policy to shift the AD curve... but now they have to make a choice:
- Stabilize inflation, but decrease output in the short-run
- Stabilize output, but increase inflation
- Fix unemployment
- Stabilizing Inflation
- Stabilizing Output
- The Bottom Line:
- If the economy experiences lots of Aggregate Demand shocks, the Fed will be able to smooth out both inflation and output over time
- Monetary policy always shifts the demand curve
- If the economy experiences more supply shocks, they must choose between:
- Stabilizing inflation in the short run, leading to inefficient output until the market adjusts
- Pro-cyclical policy
- Stabilizing output but causing inflation to be higher overall
- Anti-cyclical policy
- This is because monetary policy always shifts the aggregate demand curve, not the SRAS
- Long-run is always SRAS
- Stabilizing inflation in the short run, leading to inefficient output until the market adjusts
- If the economy experiences lots of Aggregate Demand shocks, the Fed will be able to smooth out both inflation and output over time
- How Actively Should Policy Makers Try to Stabilize Economic Activity?
- All economists have similar policy goals (to promote high employment and price stability), yet they often disagree on the best approach to achieve those goals.
- Nonactivists believe government action is unnecessary to eliminate unemployment
- Stabilizing prices
- Reallocating wages
- LR
- Activists see the need for the government to pursue active policy to eliminate high unemployment when it develops
- Getting more people in work as soon as possible
- MP
- Nonactivists believe government action is unnecessary to eliminate unemployment
- All economists have similar policy goals (to promote high employment and price stability), yet they often disagree on the best approach to achieve those goals.
- Lags and Policy Implementation
- Several types of lags prevent policy makers from shifting the aggregate demand curve instantaneously:
- Data lag: the time it takes for policy makers to obtain data indicating what is happening in the economy
- It can take years to figure out unemployment
- Recognition lag: the time it takes for policy makers to be sure of what the data are signaling about the future course of the economy
- Takes time to analyze data
- Legislative lag: the time it takes to pass legislation to implement a particular policy
- It takes time for Congress to pass a policy
- Relates to fiscal policy
- Implementation lag: the time it takes for policy makers to change policy instruments once they have decided on the new policy
- Takes time to hire people, gather materials, plan, etc.
- Effectiveness lag: the time it takes for the policy to actually have an impact on the economy
- You have to wait for people to get paid, for the people who got paid to put their money in the bank or spend it
- If you do a policy at the wrong time, it causes the economy to be worse-off
- Data lag: the time it takes for policy makers to obtain data indicating what is happening in the economy
- Several types of lags prevent policy makers from shifting the aggregate demand curve instantaneously:
- Activist vs. Nonactivist: Fiscal Stimulus Packages
- Many activists argued that the government needed to do more by implementing a massive fiscal stimulus package.
- Actively be engaged in policy to smooth out consumption and income/welfare over time
- Triggering inflation
- Actively be engaged in policy to smooth out consumption and income/welfare over time
- On the other hand, nonactivists opposed the fiscal stimulus package, arguing that fiscal stimulus would take too long to work because of long implementation lags.
- The Obama administration came down squarely on the side of the activists and proposed the American Recovery and Reinvestment Act of 2009, a $787 billion fiscal stimulus package that Congress passed on February 13, 2009.
- Increase the policy
- Many activists argued that the government needed to do more by implementing a massive fiscal stimulus package.
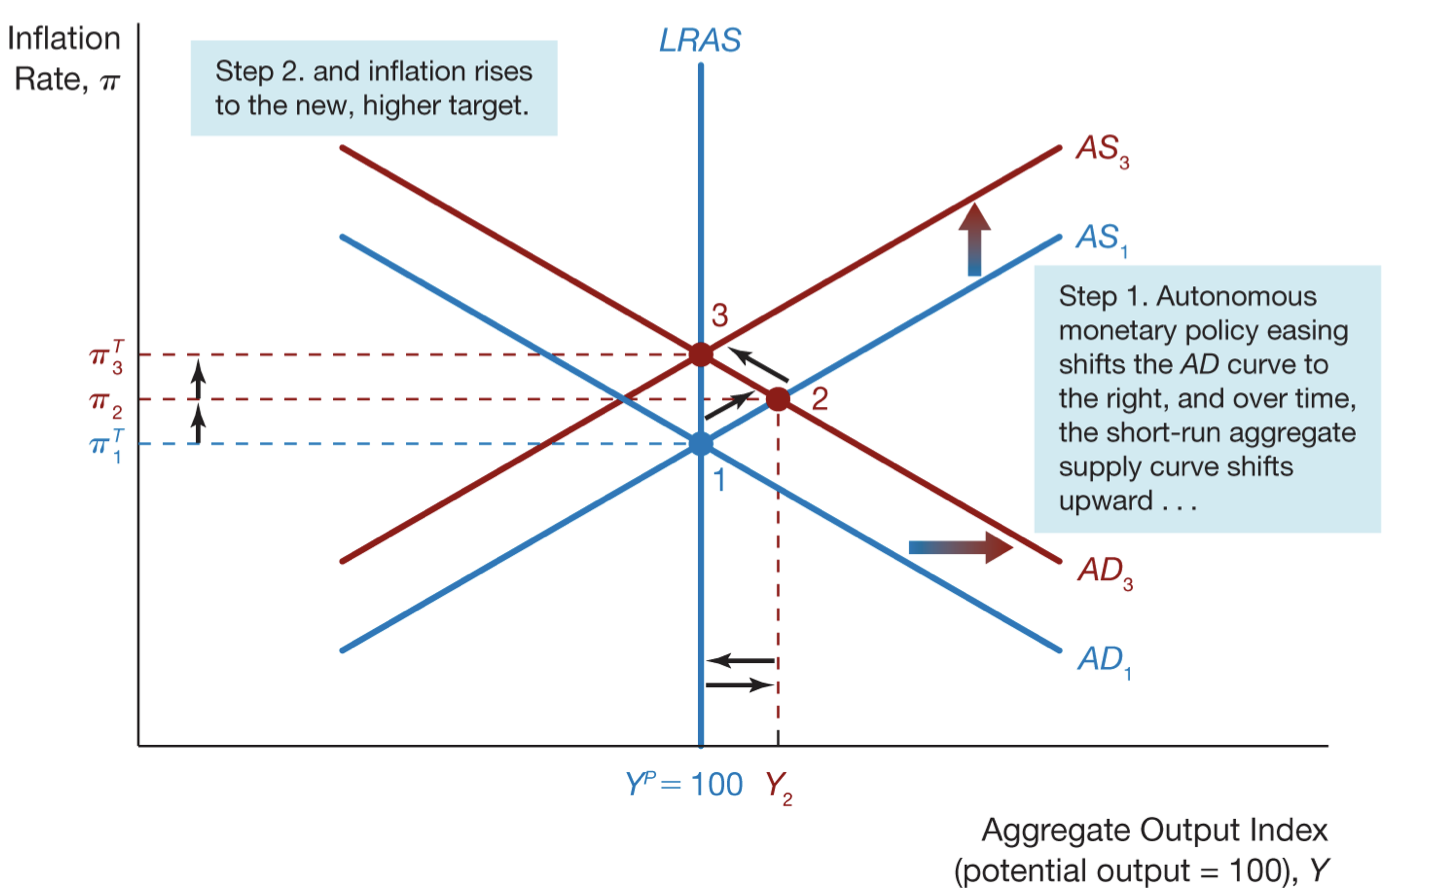
- A Rise in the Inflation Target
- Causes of Inflationary Monetary Policy
- High employment targets and inflation
- Cost push inflation results either from a temporary supply shock increasing prices or a push by workers for wage hikes beyond what productivity gains can justify
- A shock causes the AD curve to shift to the left which causes a recession and the AD curve shifts to the right and inflation increases
- C <
- Step 1. A negative supply shock shifts the short-run aggregate supply curve upward…
- Step 2. Causing output to fall and unemployment to increase.
- Step 3. Policymakers increase aggregate demand in response…
- Step 4. Leading to a spiraling rise in inflation.
- Demand pull inflation results from policy makers pursuing policies that increase aggregate demand
- D >
- Step 1. Policymakers increase aggregate demand to reach a higher output target…
- Step 2. Causing the short run aggregate supply curve to shift upward in response to rising wages…
- Step 3. Leading to a spiraling rise in inflation
- D >
- Cost push inflation results either from a temporary supply shock increasing prices or a push by workers for wage hikes beyond what productivity gains can justify
- High employment targets and inflation
- The Great Inflation
- Now that we have examined the roots of inflationary monetary policy, we can investigate the causes of the rise in U.S. inflation from 1965 to 1982, a period dubbed the “Great Inflation.”
- Just before the Great Inflation started, the inflation rate was below 2% at an annual rate; by the late 1970s, it averaged around 8% and peaked at nearly 14% in 1980 after the oil price shock in 1979.