Environmental Science
Populations
AP Environmental Science
Unit 3: Populations
2023
5 steps to a 5
generalist
specialist
k regulated
r regulated
biotic potential
survivorship curve
population overshoot
carrying capacity
age-structure diagrams
fertility rate
infant mortality rate
density dependent factors
density independent factors
demographic transition
rule of 70
12th

Chapter 7: Populations
Populations in ecosystems change over time in response to factors in their environment and populations are limited by availability of resources and space. This chapter is all about populations, both populations in nature and human populations.
Populations change over time in reaction to a variety of factors.
Human populations change in reaction to a variety of factors, including social and cultural factors.
Key Terms
Generalist: A species that can eat almost anything and live almost anywhere, like a cockroach.
Specialist: A species that only eats a specific item or live in only one place/habitat, like a koala.
K-selected species:
Large size
Few offspring per year
Live in stable environments in certain places
Specialized diets
Spend a lot of time and energy caring for their offspring
Long life spans
Reproduce more than once in their lifetime
Can be impacted by invasive species or environmental changes
R-selected species:
Small
Many offspring
Don’t take care of their offspring (or very little care)
Mature early
Short life spans
Live almost anywhere
Eat almost anything
Not as impacted by invasive species or environmental changes
Biotic potential: Maximum reproductive rate of a population if conditions were ideal. In other words, if there was plenty of room, plenty of food, no predators, and so on, then how many of a particular species could live in the area.
Type I survivorship curve: Long life, not many die young. Example: humans.
Type II survivorship curve: Die at all stages of lifetime. Example: birds.
Type III survivorship curve: Almost all die young and only few live to adults. Example: fish.
Carrying capacity: The number of organisms an ecosystem can support over time. This is often shown in a graph.
Population overshoot: When a population exceeds its carrying capacity and there is a dieback.
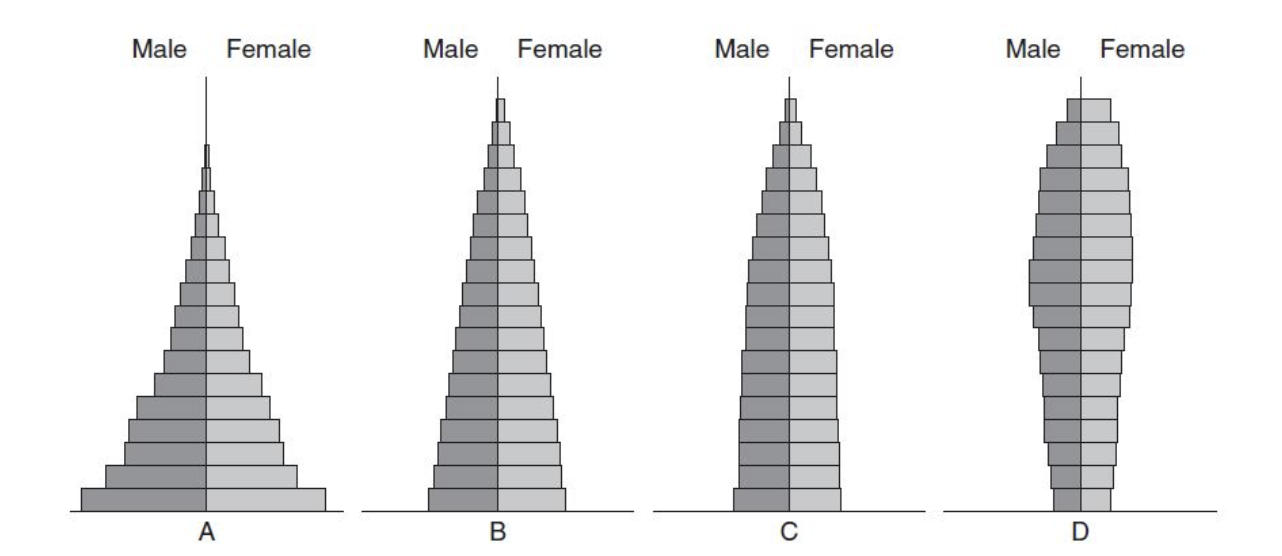
Age-structure diagrams: Pyramid-shaped graphs showing the number of female and males in each age group.
Total fertility rate: The total number of children born, or likely to be born, to a woman in her lifetime if she were subject to the prevailing rate of age-specific fertility in the population.
Infant mortality rate: The number of infants that die before their first birthday out of 1,000 births.
Density-dependent factors: Things that become worse as the density of the population is larger. Infectious disease is an example of this since the more humans there are, the faster the disease can spread.
Density-independent factors: Things such as severe storms, droughts, heat waves, and fires that can influence populations regardless of their density. For example, a tornado doesn’t hit a city more than a rural area.
Rule of 70: This is a calculation to solve for how many years it will take for a population to double. 70/growth rate = doubling time. If you are given the doubling time, then rearrange the formula to solve for the growth rate.
Demographic transition: The demographic transition model is another way to look at populations. Similar to age-structure diagrams, these are broken up into four stages: pre-industrial, transitional, industrial, and postindustrial. It demonstrates how countries change as they develop.
Generalist and Specialist Species
Generalists, defined in Chapter 6, are going to be able to survive in habitats that change often.
If the food availability of the area changes, a generalist can just change his diet and will most likely survive.
Generalist species are more adaptable than specialist species.
A specialist species will have a difficult time with changing habitat conditions.
In fact, a specialist will likely become endangered in an area if habitat conditions change because specialists are less likely to adapt to the new environment.
They require very specific conditions and specific food requirements to survive and when these conditions or requirements change they suffer or die.
k-Selected and r-Selected Species
What do we know about kangaroos?
Well, they are large animals, they have a pouch, they hop around carrying their baby for 11 to 18 months . . . that’s huge parental care!
Usually a kangaroo only has one baby at a time, or maybe twins, and they don’t have a baby until they are a few years old.
They are herbivores who live in only one place in the world (Australia) and can live 12 to 18 years on average.
What are the characteristics of k-selected species?
Large size
Few offspring per year
Live in stable environments in certain places
Specialized diets
Spend a lot of time and energy caring for their offspring
Long life spans
Reproduce more than once in their lifetime
Can be impacted by invasive species or environmental changes
What about roaches?
Roaches are small and live only a few months.
They lay lots of eggs (sometimes 16 at a time), they can lay eggs about 14 times during their life, and they can lay eggs when they are only three to five months old.
When a cockroach lays eggs they leave them and never return to care for the young.
They can live almost anywhere on the planet and eat almost anything, but they only live about six months.
What are the characteristics of r-selected species?
Small
Many offspring
Don’t take care of their offspring (or very little care)
Mature early
Short life spans
Live almost anywhere
Eat almost anything
Not as impacted by invasive species or environmental changes
Biotic potential is the maximum number of offspring a species could have if conditions were perfect.
From above, the roaches would have a high biotic potential and the kangaroos would have a low biotic potential.
In other words, if conditions for a roach were perfect, one could produce a lot of babies before it died.
On the other hand, a kangaroo, even under perfect conditions, would only produce a few babies in its lifetime.
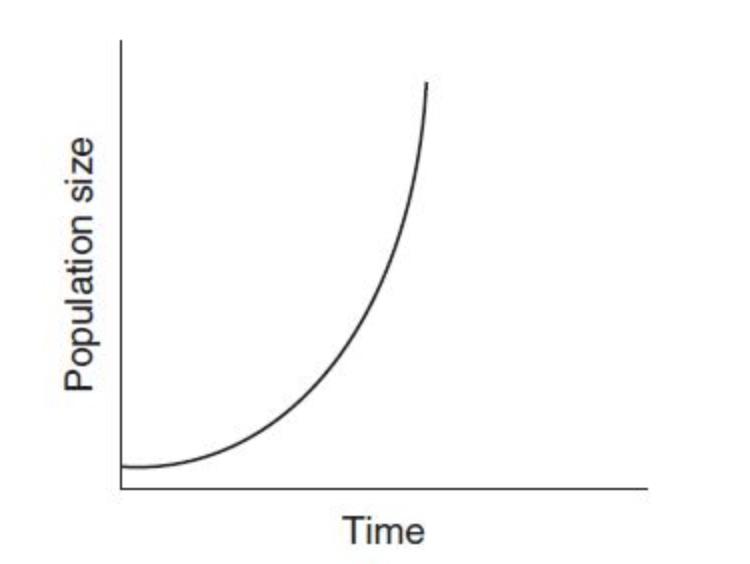
When you plot biotic potential on a graph, it would look like the letter J and is known as exponential growth (Figure 7.1).
Below is an example of exponential growth on a graph.
This section will be tested using data analysis so make sure you can recognize different graphs like the ones below.
Survivorship Curves
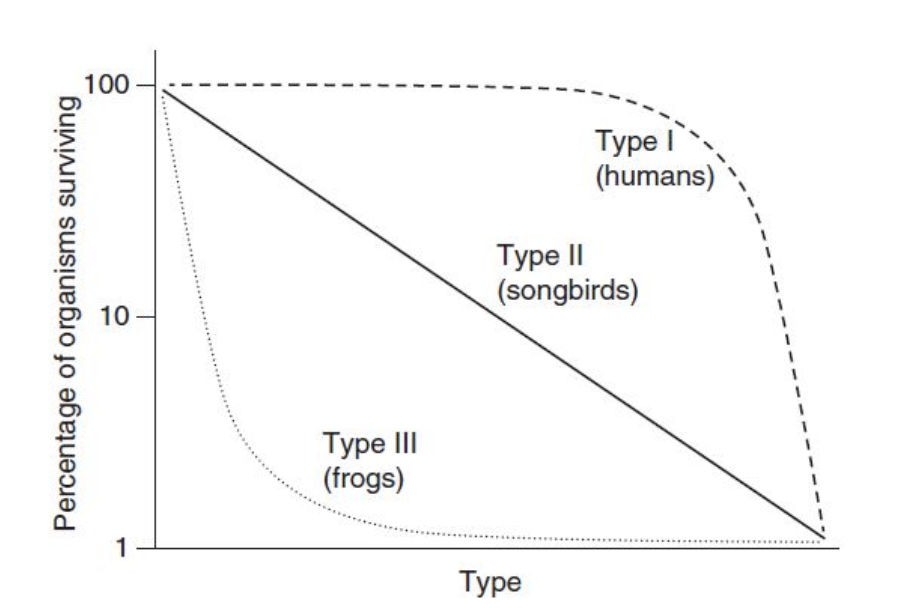
Figure 7.2 demonstrates the three survivorship curves.
Humans are the example most often used for Type I.
If you look at Type I, you can see that almost 100 percent of humans survive childhood and most humans survive many years.
Type I are often k-selected species.
Songbirds are an example of a Type II. In other words, the death rate for this species is constant during their entire lifetime.
Some die young, others in middle age, and some live a long time.
Type II are often k-selected species.
The final type, Type III, can be characterized by frogs. Very few frogs make it to adulthood.
Take frog eggs—most get eaten, dry out and never mature, or never hatch at all.
Then, tadpoles are also a major food source for many species so lots of young frogs are also killed.
However, a few make it to old age and become adult frogs. Type III are often r-selected species.
Carrying Capacity
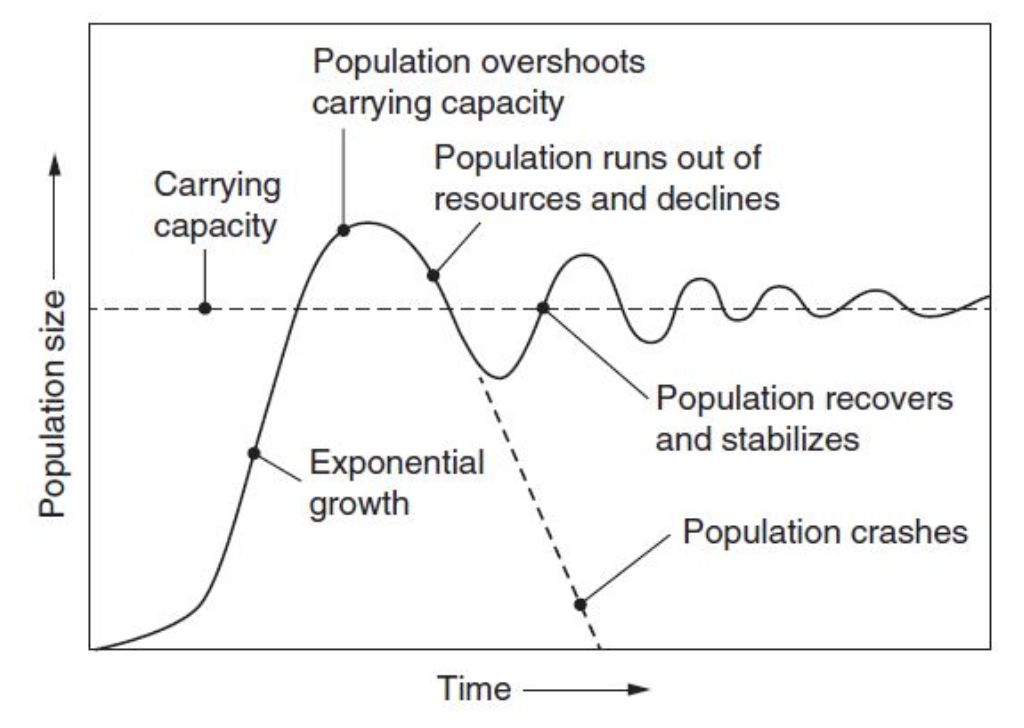
Carrying capacity is the number of organisms an ecosystem can support over time. This is often shown in a graph depicted in Figure 7.3.
The dotted line shows the carrying capacity and the solid line shows the growth of a particular species. As the species increases in number, it will sometimes overshoot the carrying capacity.
This is usually because the species has continued to reproduce beyond what the area can support.
However, there can be a lag before we begin to see the die-off because it takes a while before the species begins to starve, is impacted by disease, and so on.
A reproductive time lag is the time it takes for the birth rates to decline and the death rates to increase in response to the amount of resources in the area.
The population could crash completely if the ecosystem can’t recover.
But usually, there will be small die-off and then the population will hover around the carrying capacity.
Population Growth and Resource Availability
Populations are limited by the amount of resources available.
When resources, things like food and shelter, are available and plentiful, populations can grow.
When resources are scarce, populations will exhibit a dieback and decrease in size.
This dieback is due to species dying or species being unable to reproduce or having a decreased rate of reproduction.
Age-Structure Diagrams
The size of the population (in either total numbers or percentage) is along the x-axis.
Males are on the left side and females on the right.
Infants/children are along the bottom of the pyramid while elderly are on the top.
Each age group is represented by a bar that is usually five years each.
Rapid growth countries:
These are countries with a lot of infants, babies, and children.
These countries grow very quickly because these children will grow up and have even more children since they are close to reproductive age.
Some examples of countries with an age structure like this are Kenya, Nigeria, and Saudi Arabia.
Slow growth countries:
These are countries with more a more column-shaped pyramid with steeper sides.
There are more older people in this population than in a rapid growth country because conditions in this country (health care, food, etc.) are usually more advanced.
There are still more children than adults but not as great a difference as in a rapidly growing country.
Zero/stable growth countries:
These countries have about the same number of middle-aged people as children so they are considered stable or having a zero growth rate.
In other words, for example, a family would have two children and when mom and dad die, the two children replace mom and dad and the population remains stable.
This would be like Japan, Italy, and Greece.
Declining/negative-growth countries:
Countries like Germany, Bulgaria, and Russia are considered negative or declining growth countries because there are fewer children than middle-aged adults.
In these countries, mom and dad may only be having one child so when mom and dad die, the family (and country) gets smaller.
Total Fertility Rate
The definition of total fertility rate (TFR) is the total number of children born, or likely to be born, to a woman in her lifetime if she were subject to the prevailing rate of age-specific fertility in the population. Questions to ask are:
What is the age in the country that girls normally have their first child?
Do they wait until they are in their 30s to start having kids?
Or do they have them in their early teens?
What educational opportunities are available in the country and specifically to the women in the country?
Is there good, reliable birth control in the country and is it acceptable to use birth control?
What impact does the government have in the country when it comes to women, family planning, etc.?
All of these things can determine the total fertility rate of a country.
In a country that has a TFR of 2.0 or close to that, the country is considered in replacement level fertility because the two children will replace the parents when they die and the country has a population growth rate that is relatively stable.
Infant mortality rates are also important to understand when it comes to the country’s total fertility rate.
A country where there is not good health care and/or nutrition will have high infant mortality rates.
Infant mortality rates are expressed as the number of infants that die before they reach their first birthday out of every 1,000 births in that country.
This rate is often an indicator of the health of the country. In most cases, when infant mortality rates are high, the TFR is also usually high.
This seems to contradict itself. Well, population scientists have discovered that in developing nations, when lots of babies die, moms have even more babies to ensure at least a few make it to adulthood. So, when lots of babies die, the population usually increases dramatically.
Human Population Dynamics
Human populations can be growing or declining. There are many factors that can impact this, including:
Birth rate
Death rate
Infant mortality rate
Access to reliable birth control/family planning
Nutrition and food availability
Education, particularly for women and girls
Age of marriage
Thomas Malthus wrote an essay in 1798 in which he stated that humans were growing exponentially, but that food on our planet grew in a linear fashion.
He developed the Malthusian Theory of Population Growth in which he proposed that if left unchecked, populations (specifically the human population) will outgrow their resources, particularly food.
In other words, humans will grow beyond the Earth’s carrying capacity.
Of course, Malthus could not predict in the late 1700s that we would be able to grow food more efficiently and more abundantly with the invention of fertilizers and more.
Nor could he have known that we would have the capability to ship food around the world to where it is needed.
However, the question still exists of what is the carrying capacity for humans on Earth and could it ever be reached?
Density-dependent factors are things that affect a population as its density increases.
For example, diseases are transmitted from human to human;
if you live in a place with a lot of people you are more likely to get the disease (example: the flu)
more than if you live in the middle of nowhere on a farm with very little interaction with other humans
Other density-dependent factors are air pollution and access to clean water.
Density-independent factors are things such as severe storms, droughts, heat waves, and fires that can influence populations regardless of their density.
For example, a drought can hit a tiny town or a large city.
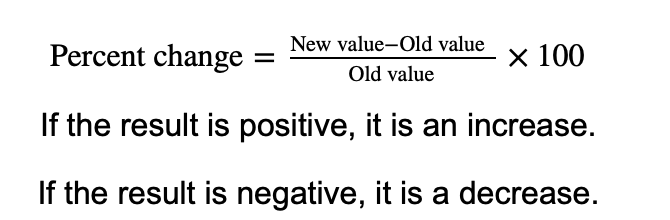
Finally, you will almost certainly be asked to solve a problem using the rule of 70. This is simply done. The formula is:
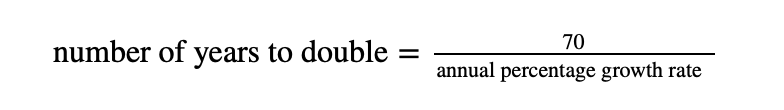
Do not change the number given to a decimal; use the percent as a whole number in the calculation.
So, if you are told the annual percentage growth rate is 4 percent, then you just take 70 and divide it by 4, so it will take 17.5 years to double.
Demographic Transition
The demographic transition model is another way to look at populations (Figure 7.5).
Similar to age-structure diagrams, these are broken up into four stages: preindustrial, transitional, industrial, and postindustrial.
The model demonstrates how countries change as they develop economically. Let’s break down each.
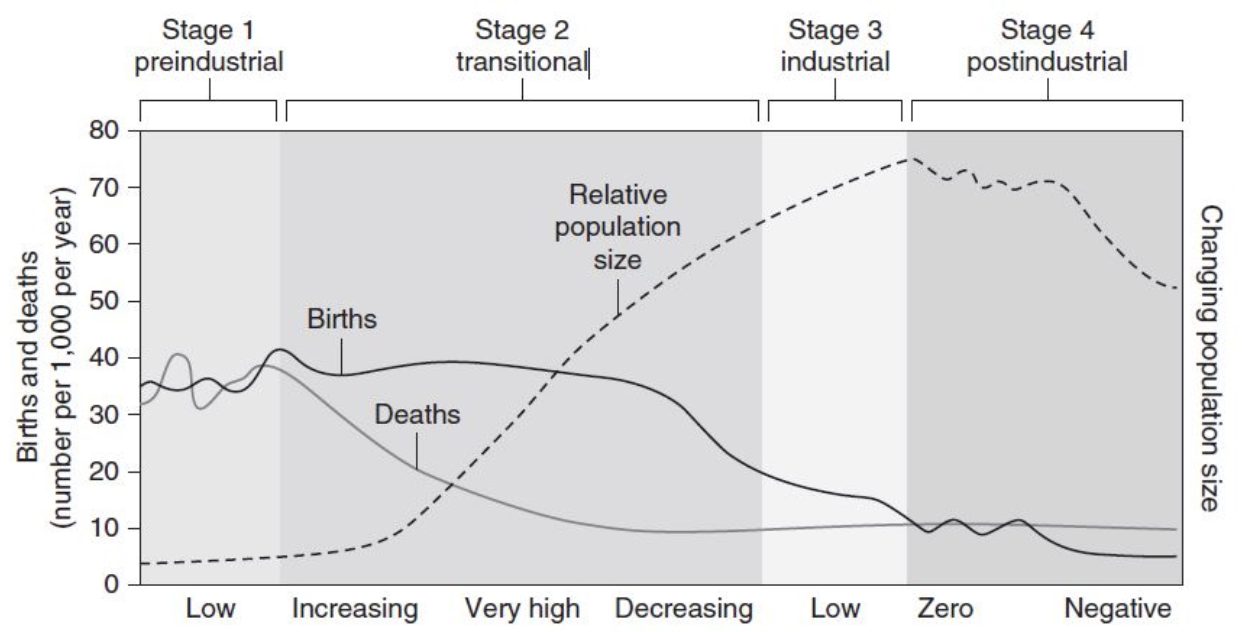
Preindustrial countries have high birth rates and high death rates so the country has a low growth rate.
This stage applied to most of the world before the Industrial Revolution.
Even though birth rates are very high, with death rates just as high the country is stable and not growing.
Transitional countries are the ones you will most likely be asked about on the exam because these are countries where birth rates stay high but death rates begin to drop due to increases in health, food availability, and medicine.
Infants begin to survive into childhood but because there are still so many births the country’s population begins to explode.
In addition, because education and birth control for women is limited, the TFR will remain high and the population will grow exponentially.
The least developed countries today are in the transitional stage of the demographic transition.
Industrial countries have birth rates that begin to drop due to access to reliable birth control, family planning, women getting educations and jobs and are similar to most developing countries today.
With birth rates dropping, the population begins to slow, but not as quickly as you might think due to population momentum.
Population momentum is the idea that even though birth rates have fallen, since there are already so many people in reproductive ages, it takes many decades for the population to finally stabilize.
In postindustrial countries economies are strong, citizens are highly educated, medical care is advanced, and women have access to many employment opportunities.
In this final stage, both birth rates and death rates continue to fall until death rates exceed birth rates and thus the population begins to decrease.