
4.3 Sales forecasting
Introduction - sales forecasting
Sales forecasting: predicting future sales levels and sales trends.
Quantitative sales forecasting methods - time-series analysis
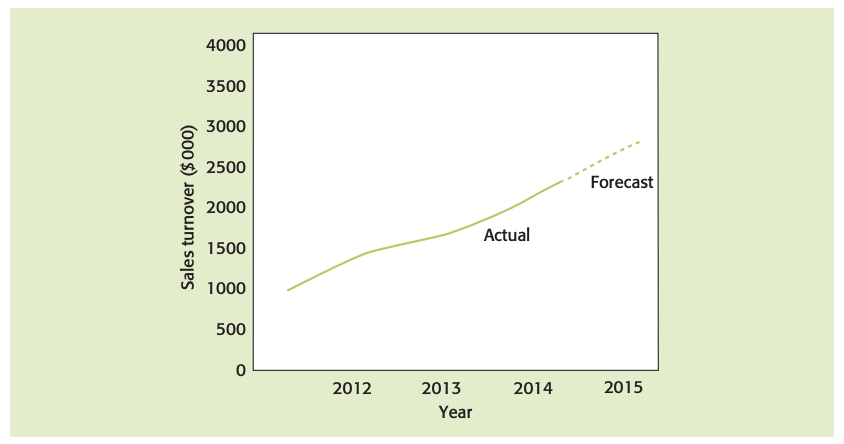
Extrapolation involves basing future predictions on past results.
Moving averages
Seasonal variations: regular and repeated variations that occur in sales data within a period of 12 months or less.
Cyclical variations: variations in sales occurring over periods of time of much more than a year they are related to the business cycle.
Random variations may occur at any time and will cause unusual and unpredictable sales figures, e.g. exceptionally poor weather, or negative public image following a high profile product failure.
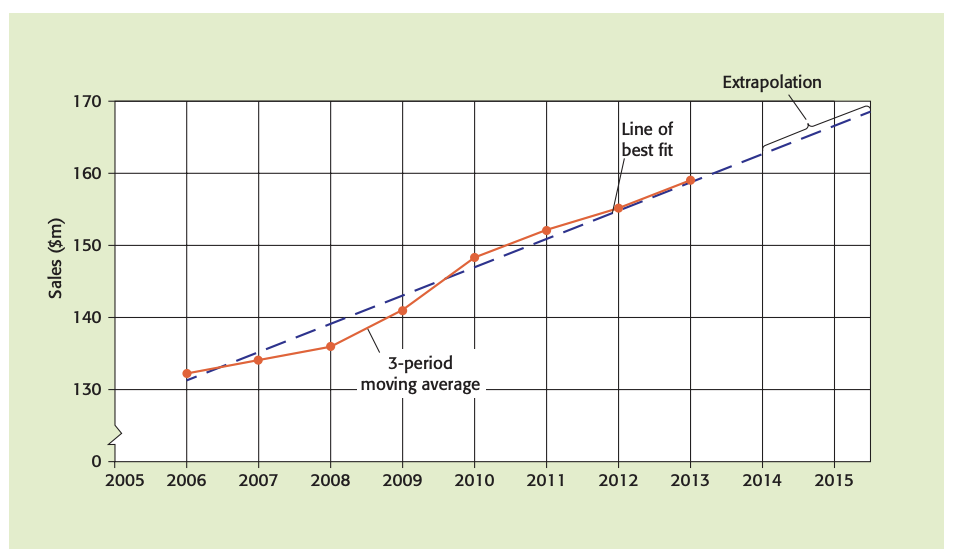
Four-period moving average: the most widely used technique as it’s often employed when forecasting from quarterly data. Much macro-economic data is released quarterly, but if it’s collected as monthly sales then a 12-period moving total can be used.
Forecasting using the moving average method
Plot the trend (moving average) results on a time-series graph.
Extrapolate this into the future short-term extrapolations are likely to be the most accurate.
Read off the forecast trend result from the graph for the period under review.
Adjust this by the average seasonal variation for quarter 2.