
Chi Square
Data Analysis through Statistics
quaLitative = what they’re like or categories
quaNitative = numbers
Chi Square
Problem = want to know everything about populations
Solution = take sample to represent the population
Purpose = take our sample data and process to see if it is significant or by chance to draw a prediction about the population
Process:
Step 1: Identify IV and DV
Step 2: Create a null hypothesis (Ho) and an alternative hypothesis (Ha)
Ho = There is no difference or effect on the DV due to IV.
Ha = There is a difference or effect on the DV due to IV.
Step 3: Determine the observed (o) and expected (e) values.
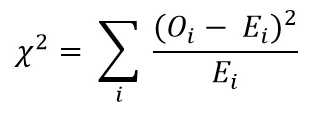
Step 4: Calculate X2
Step 5: Degree of freedom (df = n - 1); where n = # of categories in IV
Step 6: Compare X2 to critical value (p)
95% confidence = 0.05 p-value
99% confidence = 0.01 p-value
Step 7: Draw a conclusion
If X2 > p then reject Ho. Data suggests there is a difference/effect on…
If X2 < p then fail to reject Ho. Data suggests there is no difference/effect on…
Example 1: Does age impact how many times heads is flipped?
Step 1:
IV = age
DV = # of heads flipped
Step 2:
Ho = There is no effect on the # of heads flipped due to age.
Ha = There is an effect on the # of heads flipped due to age.
Step 3:
Observed Data (o) | |||
Age | # Heads | # Tails | Total |
14 | 3 | 7 | 10 |
not 14 | 2 | 1 | 3 |
Expected Date (e)
50%/5 → 1.5
Step 4:
 X2 = (3 - 5)2 / 5 +(2 - 1.5)2 / 1.5
X2 = 0.8 + 0.17
X2 = 0.97
Step 5: df - 1
Step 6:
95% confidence | 99% confidence |
|---|---|
X2 = 0.97 | X2 = 0.97 |
p = 3.84 | p = 6.63 |
Step 7: X2 < p
Fail to reject null null hypothesis Ho. Our data suggests there is no effect on head flipping due to age.