0.0(0)
Chapter 19: Disorders Associated with the Immune System
Chapter 2: Is it Relevant? Adding, Deleting & Revising
Nervous System
Passé Composé
Ch 18 - Supply Side Policies
WW2 Map Quiz


Real-life Graphs
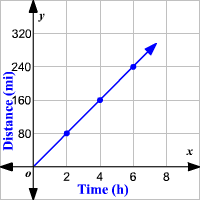
Distance-Time graphs
A distance-time graph shows how distance changes with time
The shape of the graph gives you information about what’s happening
Rates of change
The gradient on a distance-time graphs tells you the rate of change of distance with time
This is also called speed
You can use graphs to find other rates of change
The graphs show how something happens with time
It would show multiple options and their rates with a graph and you usually have to find the graph that fits the question