


Movement within the UK
about 10% of people in the UK move per year
some locally, while others move from one region to another
one region’s net gain is another’s net loss → this regional movement of people is unrestricted + often linked to the changing labour markets
Reasons for internal migration
Since the 1980s, deindustrialisation in N. Britain (e.g., steel) has driven many workers south in search of employment. The growth of footloose industries in the S.E. (e.g., electrical engineering + IT) has encouraged this, as has the growth of LDN’s knowledge economy (e.g., financial services).
The regeneration of large cities has led to the in-migration of younger people for work, as well as the attraction to the urban lifestyle. By contrast, many older adults with families move from cities into rural areas, often for a slower lifestyle.
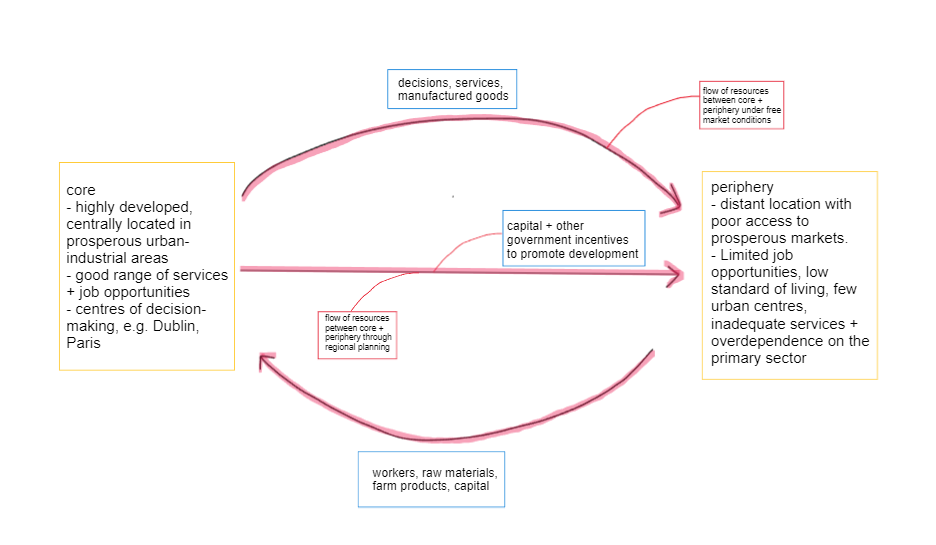
The North-South divide
UK’s North-South population drift accelerated during the 1980s
In 2015, for every 12 jobs created since 2004 in southern cities, only 1 was created in cities elsewhere
London’s global hub status means that the UK’s core-periphery and imbalance is likely to persist
the North | the South | |
|---|---|---|
economic activity | heavily dependent on the public sector | private sector dominant |
incomes | lower incomes, e.g. in 2011 average household gross disposable income was £13,560 in the North East | higher incomes, e.g., in 2011 average household gross disposable income was £20,509 in London |
unemployment | higher unemployment | lower unemployment |
house prices | lower, average in North East: £154,000 | higher, average in South East: £305,000 |
education | less likely to achieve straight A grades at A-Level and less likely to study at Oxbridge | pupils are 40% more likely to achieve top GCSE grades |
life expectancy | lower, in Manchester 2013: 71.8 male, 77.8 female | higher, male in East Dorset 2013: 83.1, female in Kensington + Chelsea 2013: 84.7 |
Reasons for these differences:
The south-east:
- has good communication links to Europe + the rest of the UK
- has a large pool of skilled and educated workers → people migrate to the area from other parts of the UK/world as it provides better job opportunities
- is less affected by deindustrialisation because there were fewer heavy industries