Chapter 4: Infographics
Infographic questions are essentially supporting evidence questions, but because they are presented in a different format from other Writing questions they can have other tips and tricks to mastery.
On every SAT writing and language test, one or two passages will be accompanied by an informational graph or chart. The passage will contain an underlying statement relating to the graphic, and you will be responsible for deciding whether the original statement accurately reflects the information in the graphic, or whether it must be changed.
There are essentially two types of infographic questions.The first one being detail based questions which ask you about a specific aspect of the graphic and the second one main big picture questions which ask you to identify an overall trend.
Although these questions may initially strike you as somewhat exotic, the most important thing is not to become too flustered by them.Unlike grammar questions, which require you to both recall and apply rules, answers to infographic questions will always be right in front of you. Furthermore, most graphics will be relatively straightforward and will not require any specialized knowledge.
“Skimming Graphs”
Although infographic questions look different from other questions, they are still vulnerable to some of the same techniques that can be used in other questions.For example, you should be careful about relying excessively on the answer choices. As always, incorrect options will be written to sound plausible.Therefore confuse you in the end.It is therefore much important in your interest to start doing basic work up front.Having a big picture understanding of the information in the chart or graph can allow you to eliminate several answers right away and will likely help you to identify the correct answer more quickly.
Ask these questions
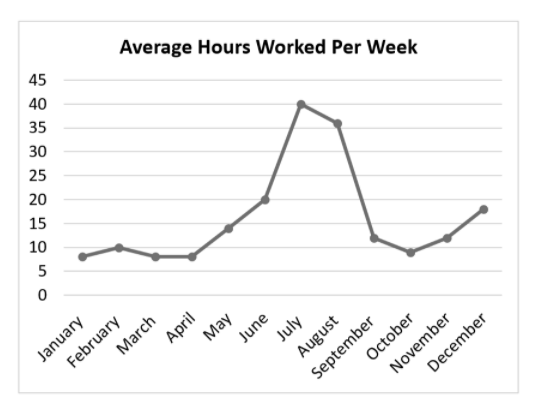
What is the shape of the graph? Does the curve go up, down or both?
Are changes steady from point to point, or is there a big jump somewhere? If so, where?
Is there an outlier point with every value different from the other values?
Any choice that clearly contradicts the general trend of a graph can immediately be eliminated.
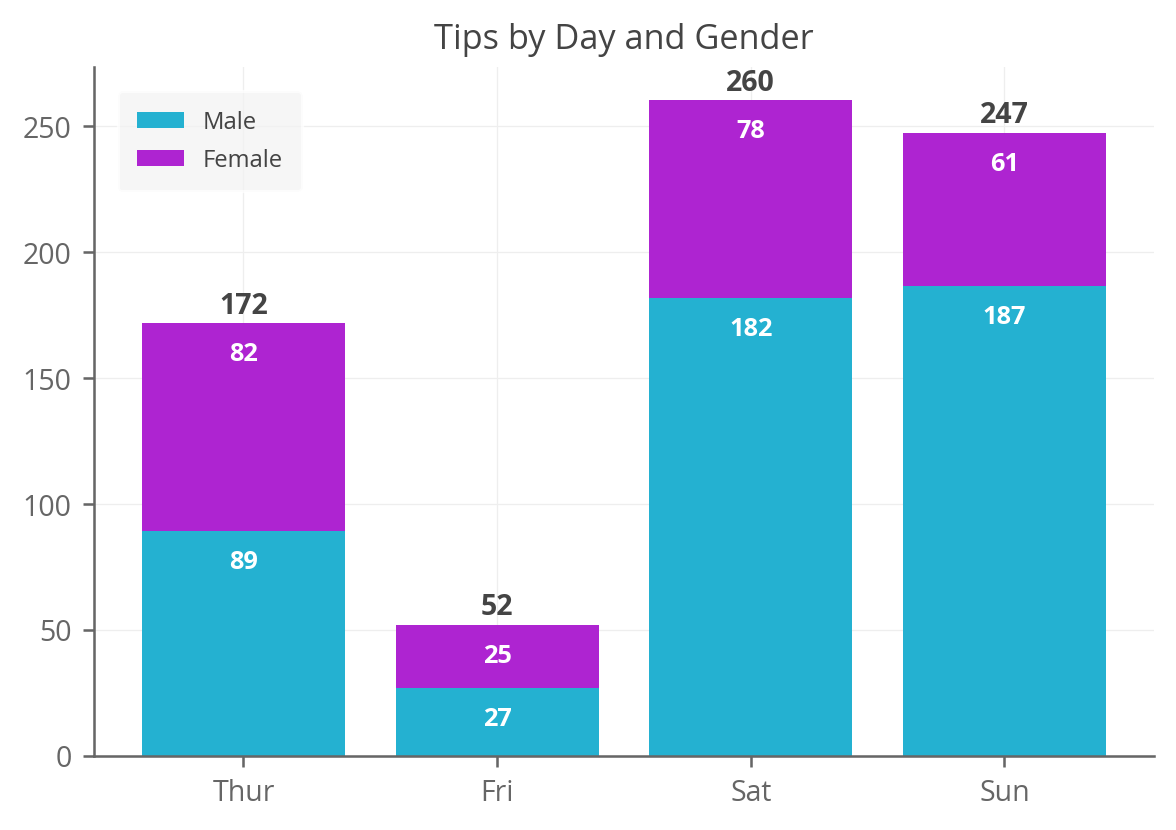
Stacked Graphs
Some of the graphs you encounter on the SAT may also be in stock form. That is a single bar may convey information more than one entity.When this is the case, you must be able to distinguish between the point on the graph where a particular curler begins and ends. The overall quantity indicated by that color.
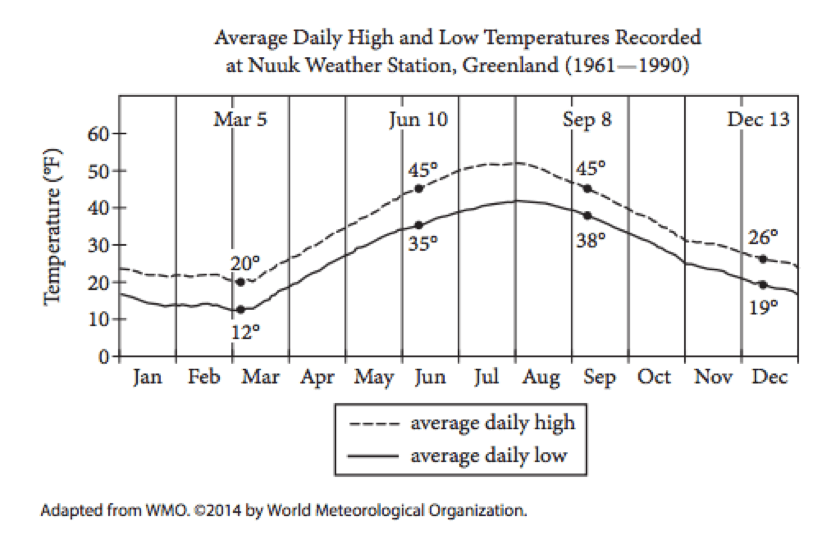
Non-Graph Graphics
Finally, you should be aware that the SAT occasionally includes ink pro graphics are not traditional bar graph form. Because the format of these graphs varies, there's no real way to study for them, nor is there any reliable way to predict which type might occur on a particular example. But not to worry. There are methods that you can use for any non standard graph that appears in this test.Although you may need an extra second to figure out what and how the graphic works, you should keep in mind that all the information that you need is right in front of you, and that the graph should be relatively straightforward and self explanatory.Make sure to read all the details carefully and don't miss any important points.