


Chapter 6: Measure Economic Activity
Households are the primary demanders of goods and services in the economy. They are also the primary suppliers of labour and other economic resources.
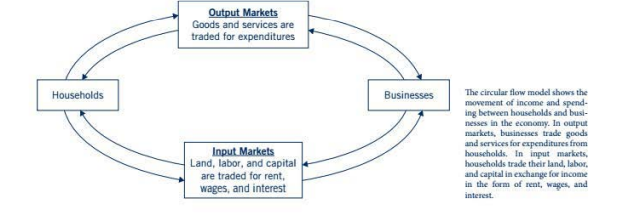
Business firms are the primary suppliers of output and the primary demanders of labour and other economic resources. The interactions between households and businesses take place in two types of markets: output markets and input markets.
Output markets are where the food, cars, medical services, music downloads, books, and all the other goods and services produced in the economy are traded.
In output markets, business firms are the suppliers of goods and services, and households are the demanders of goods and services.
The interaction of demand and supply in output markets determines the quantity of goods and services sold in the economy and the prices at which the goods and services are traded.
Input markets are the other markets where trade between households and businesses take place.
In input markets, businesses are the demanders of the land, labour, and capital inputs used to produce goods and services. Households are the suppliers of these inputs.
The circular flow model shows the movement of income and spending between households and businesses in the economy. In output markets businesses trade goods and services for expenditures from households. In Input markets, households trade their land, labour and capital in exchange for income in the form of rent, wages, and interest.
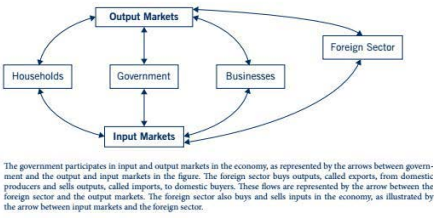
Circular flow model with Government and foreign sector:
Spending in input markets would provide a measure of all of the income that is being earned in the economy, whereas spending in output markets would provide a measure of all of the production that is taking place in the economy.
In a simple economy like this, increases in income for households would cause increased spending on goods and services, and both the input and output markets would have increased levels of activity.
Alternatively, if production slows down, firms will hire fewer inputs, and activity in input markets would decrease. In turn, households would have less income, which would be reflected by decreased demand for goods and services and reduced spending in output markets.
A closed economy is one that does not engage in international trade.
Most countries have open economies because they trade goods and services with other nations.
In addition, most economies have a government that participates in the economy by buying goods and services and hiring employees to perform government work.
Government is a demander in input markets when it hires workers or buys land and capital.
Government is a supplier in input markets when it sells or rents its resources to buyers.
The sale of goods and services to foreign buyers is called exports.
The purchase of foreign-made goods and services by domestic buyers is called imports.
Gross Domestic Product (GDP) measures the dollar value of all final goods and services produced in an economy during a given period (such as per quarter or per year). Final goods and services are goods that are sold to their end users and will not be sold again.
GDP is called gross domestic product because it counts only production that occurs within a given economy's borders. U.S. GDP does not count goods produced abroad by U.S.-based companies (such as IBM computers assembled in Taiwan) but does count goods produced in the United States by foreign-based companies (such as Subaru cars assembled in Indiana)
The income approach uses incomes earned by producers to measure GDP.
The value added approach uses total sales minus the value of inputs to measure GDP.
The expenditures approach uses total expenditures on final goods and services to measure GOP.
The expenditures approach is the most commonly used measure of GDP. Using the expenditures approach, GDP can be divided into four basic components: consumption expenditure (C), private investment (I), government expenditure and investment (G), and net exports (exports [X] minus imports [M]). The expenditures approach measures GDP as
GDP = C + I + G + (X - M)
1) Consumption (C):
Consumption (C) is household spending on final goods and services.
Purchases of items like TVs, groceries, restaurant meals, and doctor and lawyer services are counted in consumption.
Because the C component of GDP is a measure of household spending on final goods and services, it does not include the value of output produced at home but not sold in the market.
Consumption is generally the largest component of GDP, accounting for about 71 percent of total GDP in 2011.
2) Investment (I)
Private investment (I) is a measure of business spending on equipment used in production, spending on construction, and changes in business inventories. It is called private investment to distinguish it from government investment, which is included in G.
Business spending on tools, computers, and buildings is investment, as is spending on new residential housing.
Changes in businesses' inventories of goods are also counted as investment so that all of the goods that are produced in a given period are counted, even if they are not sold in the same period.
Investment does not include the purchases of financial products like stocks and bonds, because stocks and bonds are not goods and services that are produced.
Investment accounted for about 13 percent of GDP in 2011.
3)Government Expenditure and Investment (G) :
Government expenditure and investment (G) includes government spending on wages for government employees, government purchases of services, government purchases of final goods, and government investment in buildings and other capital.
Not all government spending is included in GDP because spending on things such as social security, debt service, and unemployment insurance are not purchases of goods and services.
Government expenditure and investment made up about 22 percent of GDP in 2011.
4)Net Exports (X - M)
Net exports is a measure of the difference between exports and imports.
Exports are goods produced domestically but sold abroad.
Imports are goods that are produced abroad but purchased domestically.
Exports are included in GDP because they are produced domestically but not captured in the other expenditure components of GDP.
Because the measures of expenditures on consumption, investment, and government expenditure include spending on imported goods, we subtract off the value of imports from GDP to ensure that it only includes domestic production.
America imported more than it exported in 2011, so U.S. net exports in 2011 were negative, accounting for about - 4 percent of GDP.
Aggregate demand (AD) is the demand for all goods and services in an economy.
Aggregate supply (AS) is the supply of all goods and services in an economy.
Aggregate means to gather a set of items together to form a total or whole.
Aggregate demand (AD) represents the whole of the demand for all goods and services of the economy at different price levels.
Aggregate supply (AS) represents the whole of the supply of all the goods and services in the economy at different price levels.
The price level is a measure of the average level of prices in an economy.
In the AD/AS model the horizontal axis represents total output per period (GDP) and the vertical axis represents the price level in the economy. The intersection of AD and AS tells the equilibrium level of GDP and the equilibrium price level in the economy.
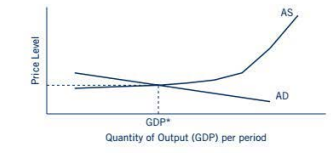
As the price level rises, businesses have an incentive to increase their production of goods and services, which will move the economy upward along the AS curve.
When prices fall, businesses cannot afford to cover the cost of as much production, so they reduce their output levels and the economy moves down along the AS curve.
On the demand side, increases in the price level reduce the amount of goods and services that consumers can buy, so the quantity of goods and services demanded falls and the economy moves upward along the AD curve.
Alternatively, reductions in the price level increase the amount of goods and services that consumers can buy, which moves the economy downward along the AD curve.
As in the usual model, the AS curve is positively sloped, indicating that the quantity of goods and services produced tends to increase as the prices of goods and services increase.
In the AD/ AS model, however, the AS curve becomes steeper as the quantity of output produced increases.
The steep portion of the AS curve is meant to illustrate the idea that resources and technology place a limit on the amount of output that an economy can produce.
It is helpful to think of the steep portion of the AS curve as a representation of the economy moving to a point on its production possibilities frontier. Because there is no increase in output possible beyond the PPF, points on the PPF would correspond to vertical portions of the AS curve.
At low levels of output, the AS curve is relatively flat. The flat portion of the AS curve reflects the underutilization of resources relative to the economy's potential.
At low levels of aggregate output, it is relatively easy to increase production without also having large increases in the price level.
This is because at low levels of output there are many idle resources available that can be used in production at relatively low cost.
As production expands and the economy moves closer to its full capacity, attracting additional resources into production becomes more expensive and the AS curve becomes steeper.
Aggregate demand is composed of all of the consumption, investment, government spending, and net export expenditures that make up GDP. Changes in any of these components of AD will cause shifts in AD. Changes in government spending or in exports and imports can also shift AD.
Aggregate supply represents the production of all final goods and services in the economy. Important shifters of AS include the prices of inputs needed to produce goods and services, the productivity of inputs, changes in technology used in production, and the cost of financing business activities. If the overall prices of widely used inputs increase, AS will shift inward.
As in the demand and supply model, shifts in either the AD or AS curves can cause changes in the quantity of output and the price level in the economy.
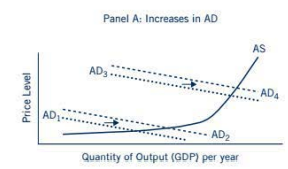
The graph below illustrates the impacts of increases in AD and AS in the economy.
Panel A shows the impact of two different increases in AD.
The first increase is from AD1 to AD2, along the relatively flat portion of the AS curve.
The second increase is from AD3, to AD4, along the steeper portion of the AS curve.
As in the usual demand and supply model, an increase in AD from AD1 to AD2, or from AD3, to AD4, generates a temporary shortage of goods and services at me old price level.
This shortage puts upward pressure on prices and gives suppliers incentive to increase their production.
As a result, the economy moves along the AS curve to a higher price level and higher amount of GDP than before.
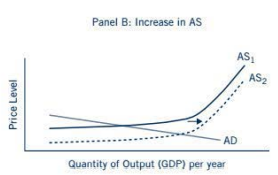
Panel B illustrates the impact of an in increase in AS on the economy.
A shift in AS from AS1, to AS2, causes a temporary surplus of goods and services at the old price level.
The surplus puts downward pressure on prices.
As prices fall, the economy moves downward along the AD curve to a new equilibrium.
An increase in AS causes an increase in economic output and a decrease in the price level.
Business Cycles are recurring expansions and contractions in the level of aggregate economic activity.
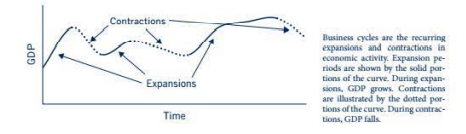
Business cycle expansions are periods of increasing economic activity, rising production, and increasing employment.
Business cycle contractions or recessions are periods of decreasing economic activity, falling production, and falling employment.
Business cycles are the recurring expansions and contractions in GDP over time.
Business cycle expansions are characterized by increasing levels of employment, increased production, and increases in the average prices of goods and services in the economy.
Business cycle contractions or recessions are periods of slowdown in economic activity, reduced employment, and declines in production.
The AD/AS model can be used to show how changes in the behaviour of buyers and sellers impact GDP.
Increases in AD or AS cause increases in GDP and are associated with business cycle expansions. Decreases in AD or AS can cause business cycle contractions or recessions.