


Motion
Vector VS Scalor
**Vector quantities **are physical quantities which can move in a direction and have a magnitude, whereas %%scalar quantities %%only have a magnitude but do not move in a direction.
Examples of Vector Quantities
Velocity
Acceleration
Momentum
Polarization
Thurst/Drag
Force
Weight
Displacement
Examples of Scalar Quantities
Temperature
Mass
Speed
Volume
Time
Distance
Density
Energy/Work
Key Terms & Definitions
Term | Symbol | Definition | Formula | SI Unit | Vector or Scalar? |
|---|---|---|---|---|---|
Displacement | s | Displacement is the distance of a certain direction | n/a | m | Vector |
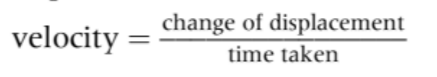
Velocity | v or u | The rate of change in displacement |
|
| Vector |
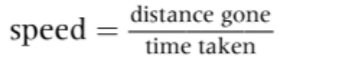
Speed | v or u | The rate of change in distance |
|
| Scalar |
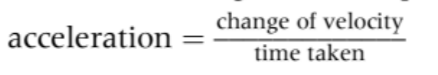
Acceleration | a | The rate of change in velocity |
|
| Vector |
Instantaneous vs Average
An average value is a value over a certain period of time
An instantaneous value is a value is that value at one particular time
Frames of Reference
The relative velocity is the velocity of an object in regard to another object.
It is the rate at which one object's relative position changes (rate of change) with respect to another object over time.
For example, if a motorcycle is driving at a velocity of120 km/h, and another car is driving at a velocity of 90 km/h, then from the point of view of the car’s passenger, the velocity of the motorcycle relative to the car is 30 km/h
Explanation
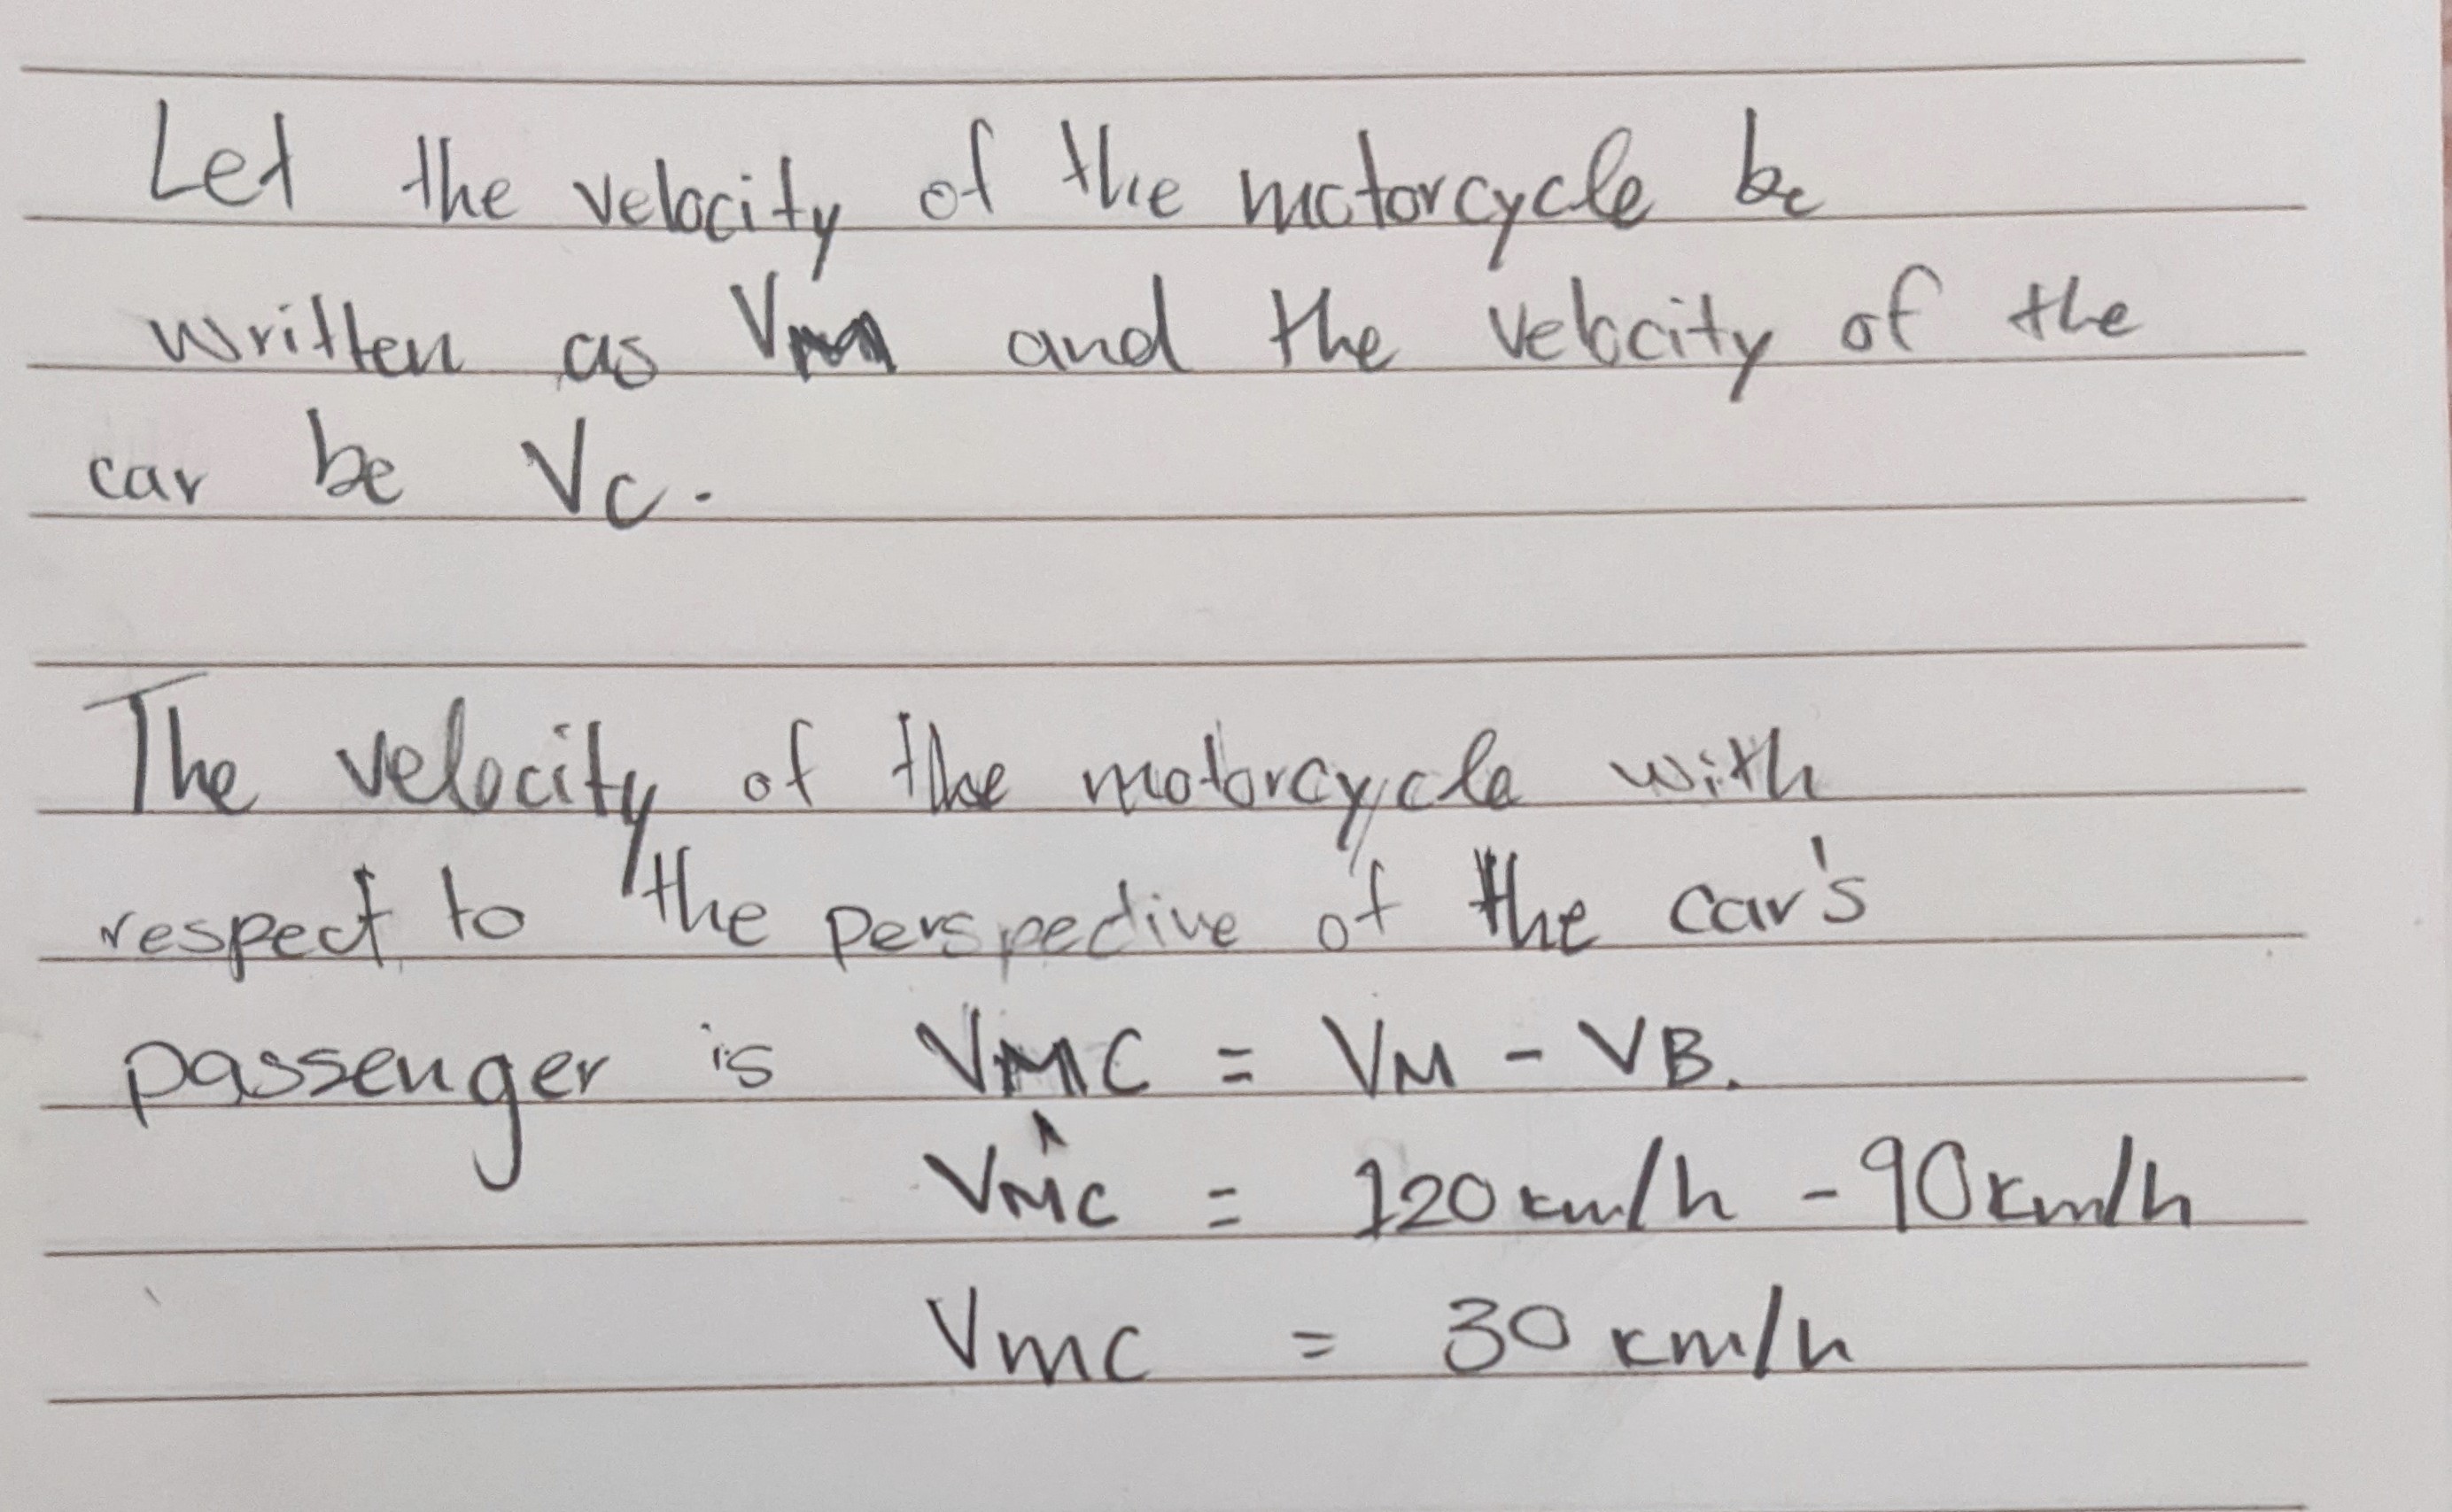 Therefore, the relative velocity of the motorcycle with respect to the car’s passenger is +30km/h.
In technical terms, we are shifting from one frame of reference to another.
Graphical Representation of Motion
There are 3 types of graphs that can provide relevant information on the motion:
Displacement - Time graphs
Velocity - Time graphs
Acceleration - Time graphs
There are 2 main ways to determine certain physical quantities within these graphs. The certain physical quantities depend on what is being plotted in the graph.
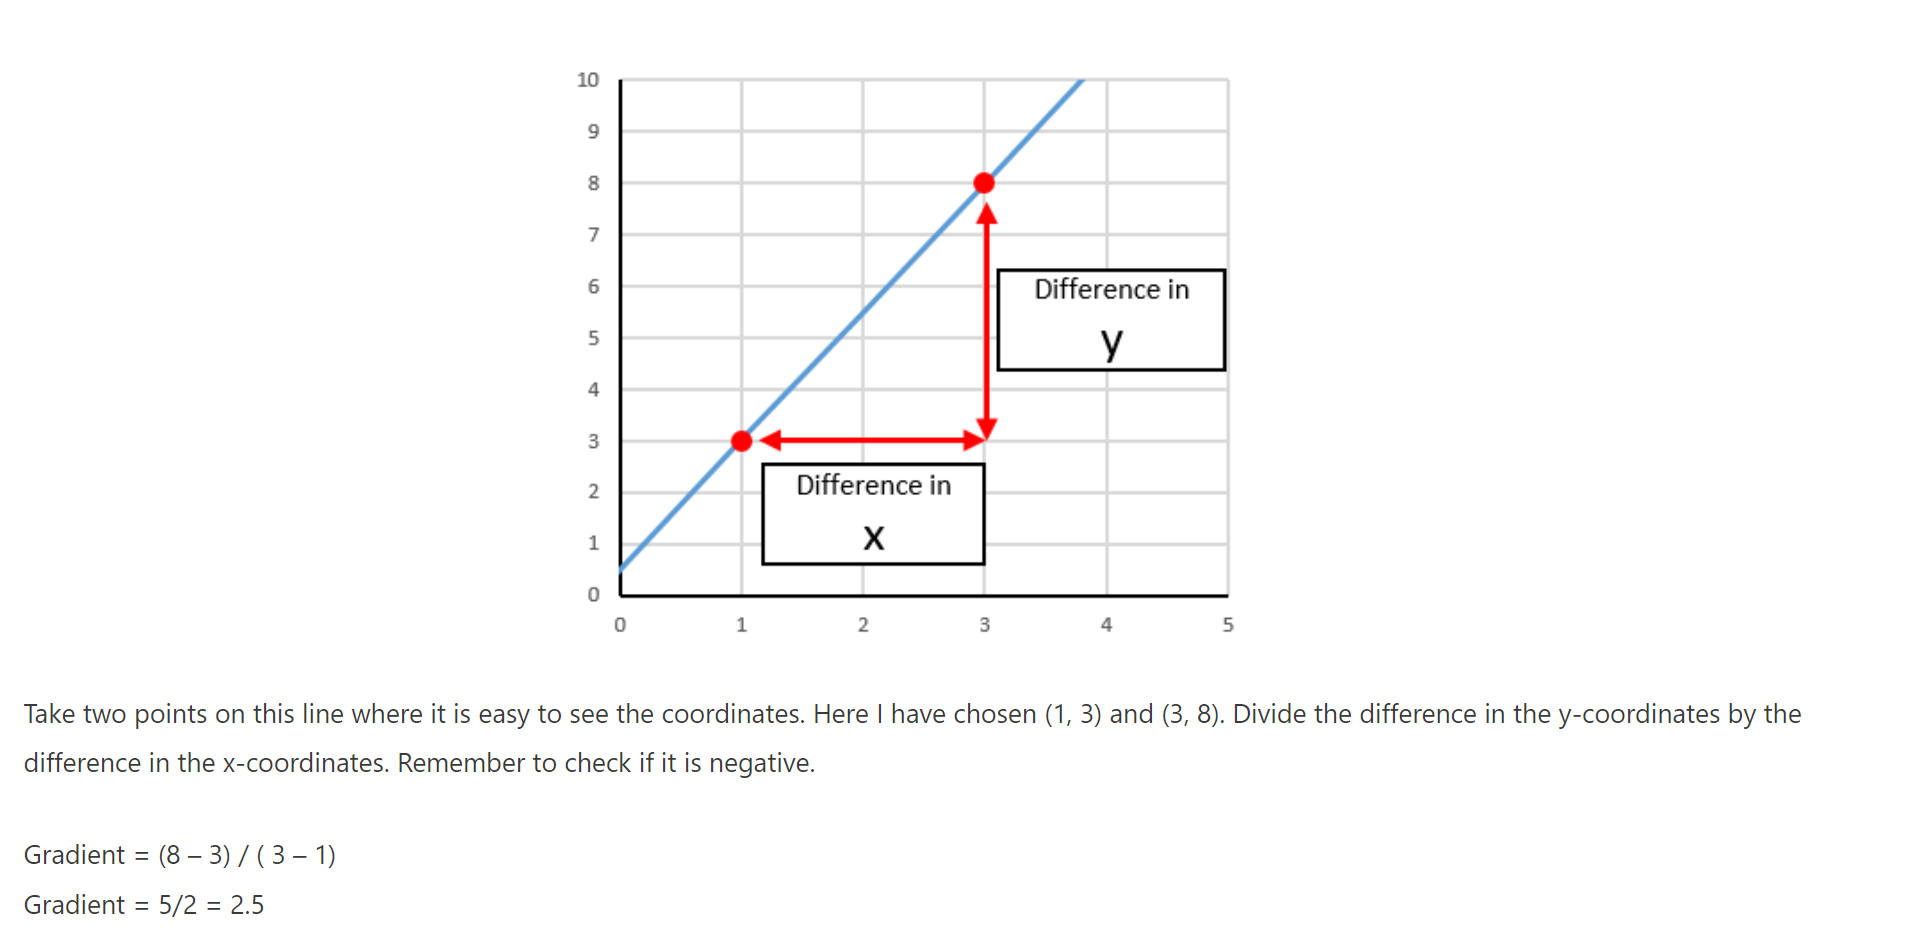
1. Finding the gradient of the line
WHAT IS A GRADIENT?
The gradient of the graph is how much it slopes; the larger the gradient, the more vertical it is and the smaller the gradient is, the more horizontal it is.
Negative gradients have a downward slope
To find the gradient, you divide the difference in the y values by the difference in the x values.
You can find the gradient of:
a straight-line section of the graph (which finds an average value) or
the tangent of the graph at a certain point (this finds the instantaneous value)
2. Finding the area under the line
Consider objects that move in a certain direction
In complicated graphs, if the object moves up and then down or forward and then backwards, determine the two velocities by choosing which direction is positive.
which direction you choose does not matter
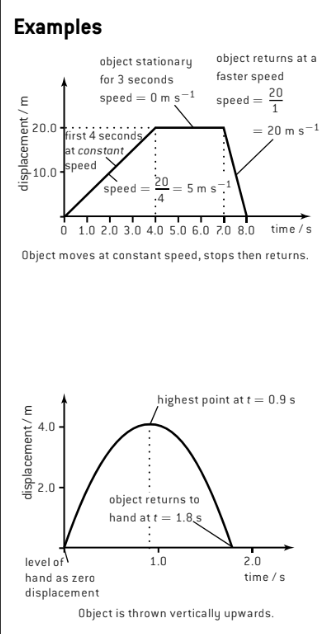
Displacement-Time Graphs
In displacement-time graphs, the gradient is the velocity
The area under this type of graph does not portray anything valuable
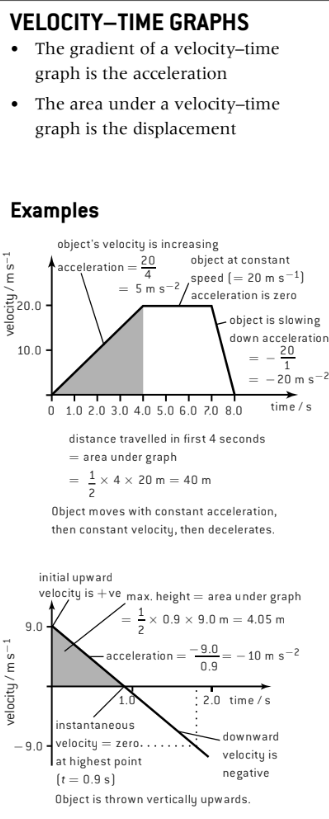
Velocity-Time Graphs
The gradient in this type of graph displays the acceleration
The area under the graph displays the **displacement **
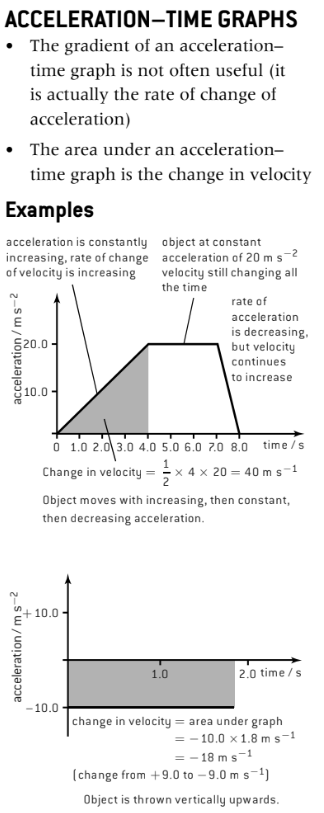
Acceleration-time graphs
The gradient of this graph is typically useless
Depicts the rate of change of acceleration
The area under the graph showcases velocity
Displacement in 2 Dimension
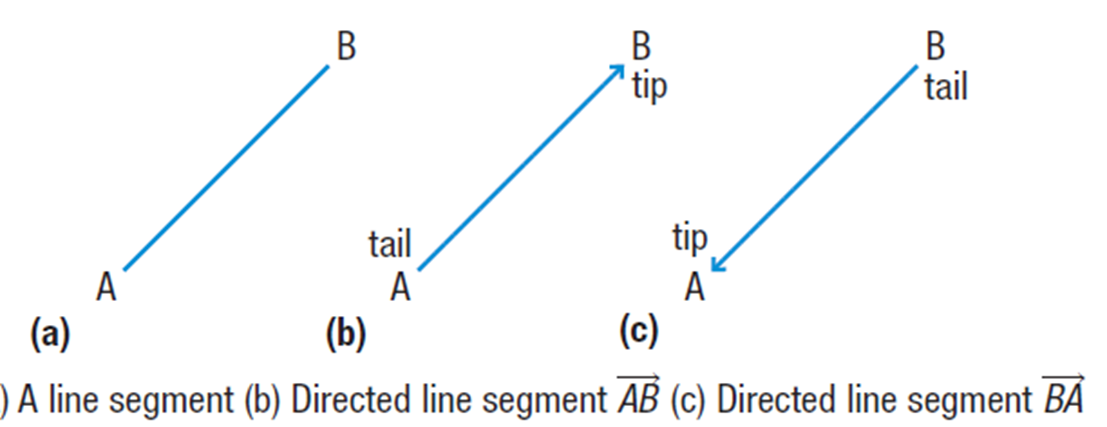
Vector Scale Diagram: a vector diagram with a specific scale that includes a directed line segment
Directed line segment: a line which connects to points in a specific direction

There are 3 main components within a vector scale diagram:
Length
how long the vector is
Tip
The point at which the vector starts.
Tail
The point at which the vector ends; it is indicated by an arrow
Drawing Vector Diagrams
Select a Scale and record it.
Select and write down a Reference System (a collection of instructions).
Draw the line segment in the proper direction and measure it using the scale.
Create an arrowhead at the vector's end.
Label the Vector
Vector Directions
A compass rose can be given to determine the direction of a vector.
[N 25° E] implies to begin at North (N) and angle your direction arrow 25° towards East (E). This signifies that N is the point of reference.
Other approaches to describe this direction are [25° E of N], [25° E from N], [E 65° N], and [65° N of E].
[25° E of N] implies to turn your direction arrow 25° towards the East, but to begin at the North (N).
[25° E from N] indicates to turn your direction arrow 25° towards the East, but to begin from the North (N).
This means that N serves as the reference for both.
If the number comes first, the reference direction comes last.