Macroeconomics
AP Macroeconomics
Unit 2: Economic Indicators and the Business Cycle
Gourishankar Residential English Medium School
circular flow model
consumers
firms
product market
factor market
GDP
national income concepts
unemployment
prices indices and inflation
nominal and real income
costs of inflation
real v/s nominal GDP
business cycles

Unit 2: Economic Indicators and the Business Cycle
In unit 2, we will dive into all the indicators that economists use to explain the health of the economy.
2.1 Circular Flow and GDP
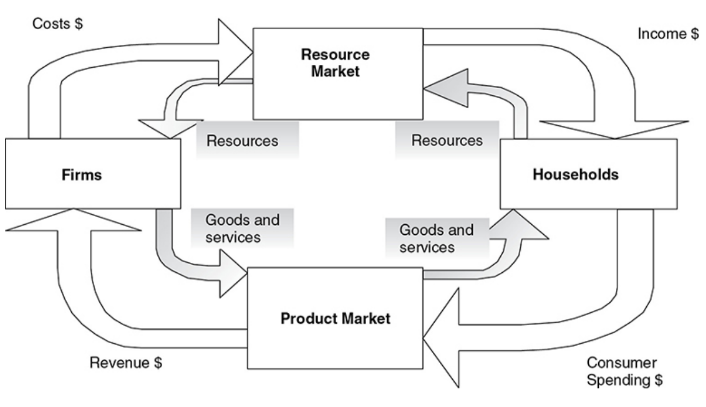
The Circular Flow Model
Circular flow of economic activity - A model that shows how households and firms circulate resources, goods, and incomes through the economy. This basic model is expanded to include the government and the foreign sector.
Closed economy - A model that assumes there is no foreign sector (imports and exports).
Now, let’s dive into the components of the circular flow diagram.
Consumers:
Consumers are the people who buy the goods/services in an economy.
So, technically everyone is a consumer.
Consumers send money to the product market by buying goods.
They also interact with the factor market in which they provide labor and receive wages or income.
Firms:
Producers in the economy.
Firm is any business that produces goods and supplies them to the product market and then receives the payment for those goods.
Firms receive factors of production from the factor market and then pay them with wages.
Product Market
The market where firms sell goods and services.
A sweet exchange of goods and services for money between firms and households.
Plays a crucial role in the economy.
The interaction between demand and supply in the product market determines:
Prices of goods and services
The number of goods and services that are exchanged.
Factor Market
The market where factors of production such as labor, capital, and land are bought and sold.
These factors are used by firms to produce goods and services, which are then sold to households in the goods market.
Gross Domestic Product (GDP)
Gross domestic product (GDP) - The market value of the final goods and services produced within a nation in a given period.
Aggregate spending (GDP) - The sum of all spending from four sectors of the economy. GDP = C + I + G + (X – M).
Consumer spending (C) - Spending done by customers.
Investment spending (I) - Investment is defined as current spending to increase output or productivity later.
Three general types of investment are included in GDP:
New capital machinery purchased by firms.
New construction for firms or consumers.
The market value of the change in unsold inventories.
Government spending (G) - Purchases made by the government for final goods and services and investments in infrastructure.
Net exports (X– M) - Exports → X, Imports → M
K.I.S.S.: Keep It Simple, Silly
GDP = C + I + G + (X - M) = Aggregate Spending = Aggregate Income (Y) = Sum of all value added
National Income Concepts
Aggregate income (AI) - The sum of all income—Wages + Rent + Interest + Profit—earned by suppliers of resources in the economy. With some accounting adjustments, aggregate spending equals aggregate income and also equals the sum of the value added.
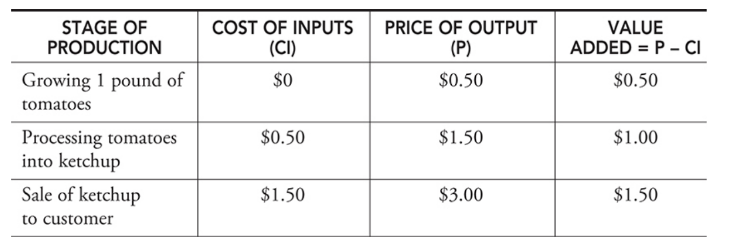
Value-added approach - A third approach to calculating GDP that considers all stages of production of a final good and the value that was added to the final good along the way.
What is not included in GDP?
Illegal Activities:
transactions concerning illegal activities like drug trafficking, gambling, etc.
Unpaid work:
Volunteering and caregiving are not included in GDP.
not a market transaction.
Transfer payments:
not represent the production of goods and services.
like social security benefits or unemployment insurance.
Intermediate goods:
the goods used in the process but not counted for final consumption.
Depreciation:
wear and tear on capital goods, such as machines or buildings is not included.
2.2 Limitations of GDP
Uses of GDP in Economics
1. Measuring Economic Growth
GDP is used to measure the economic growth of a country. It provides a way to compare the economic performance of different countries over time.
A higher GDP indicates that the economy is growing, while a lower GDP indicates that the economy is contracting.
2. Comparing Living Standards
GDP per capita is used to compare the living standards of different countries.
It measures the average income per person in a country.
Countries with higher GDP per capita generally have higher living standards.
3. Assessing Business Cycles
GDP is used to assess the business cycles of a country. Business cycles refer to the fluctuations in economic activity over time.
GDP can be used to identify periods of economic expansion and contraction.
4. Formulating Economic Policies
GDP is used to formulate economic policies. Governments use GDP data to make decisions about fiscal and monetary policies.
For example, if GDP is growing too slowly, the government may implement policies to stimulate economic growth.
5. Attracting Foreign Investment
GDP is used to attract foreign investment.
Countries with higher GDPs are generally seen as more attractive to foreign investors.
This is because a higher GDP indicates a more stable and prosperous economy.
Limitations of GDP
There are 4 main areas of limitation of GDP:
Acronym: P-I-E-S
1. Population
When populations are different from country to country but produce a similar amount of products.
This gives an inaccurate picture of GDP.
2. Inequality
It’s a limit in measuring the standard of living.
Two countries with the same GDP but unequal distribution of income among all.
3. Environment
It’s a limit to measure the health of the economy.
4. Shadow economy
It involves the items which are not counted in GDP.
Shadow economy is the black market.
2.3 Unemployment
Employed - A person is employed if they have worked for pay at least one hour per week.
Unemployed - A person is unemployed if they are not currently working but are actively seeking work.
Measuring the Unemployment Rate
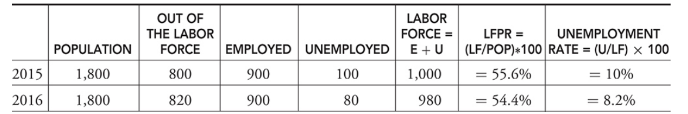
Labor force - The sum of all individuals 16 years and older who are either currently employed (E) or unemployed (U). LF = E + U.
Out of the labor force - A person is classified as out of the labor force if they have chosen to not seek employment.
Labor force participation - The ratio of the size of the labor force to the size of the population 16 years and older. LFPR = (LF/Pop)*100.
Unemployment rate - The percentage of the labor force that falls into the unemployed category. Sometimes called the jobless rate. UR = 100 × U/LF.
Discouraged workers - Citizens who have been without work for so long that they become tired of looking for work and drop out of the labor force. Because these citizens are not counted in the ranks of the unemployed, the reported unemployment rate is understated.
Types of Unemployment
Frictional unemployment - A type of unemployment that occurs when someone new enters the labor market or switches jobs. This is a relatively harmless form of unemployment and is not expected to last long.
Seasonal unemployment - A type of unemployment that is periodic, predictable, and follows the calendar. Workers and employers alike anticipate these changes in employment and plan accordingly, thus the damage is minimal.
Structural unemployment - A type of unemployment that is the result of fundamental, underlying changes in the economy such that some job skills are no longer in demand.
Cyclical unemployment - A type of unemployment that rises and falls within the business cycle. This form of unemployment is felt economy-wide, which makes it the focus of macroeconomic policy.
Full Employment
Full employment - Exists when the economy is experiencing no cyclical unemployment.
The natural rate of unemployment - The unemployment rate associated with full employment, somewhere between 4 to 6 percent in the United States.
2.4 Prices Indices and Inflation
The Consumer Price Index (CPI)
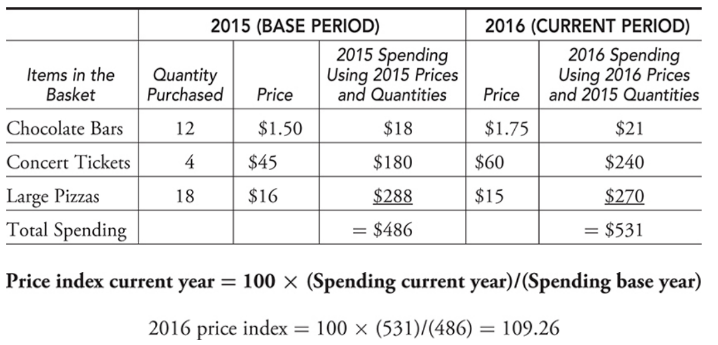
Consumer price index (CPI) - The price index that measures the average price level of the items in the base year market basket. This is the main measure of consumer inflation.
Deflation: the general decrease in prices.
Inflation: the general increase in prices.
Disinflation: a decrease in the rate of inflation.
Inflation rate: the percentage change in aggregate price level across an entire economy in a year.
Market basket - A collection of goods and services used to represent what is consumed in the economy.
Inflation
Inflation - The percentage change in the CPI from one period to the next.
The annual rate of inflation on goods consumed by the typical consumer - The percentage change in the CPI from one year to the next.
Ex. → In January 2000, the CPI was 169.30, and one year later in January 2001, it had risen to 175.60. We need to calculate the percentage change in the CPI to calculate inflation. Inflation = (175.60 — 169.30)/169.30 = .037 or 3.7%
Difference between CPI and GDP Deflator
The CPI is based on a market basket of goods bought by consumers, including the ones produced abroad. It’s a measure of inflation of only consumer goods.
Consumer Inflation rate = 100 x (CPI new - CPI old)/ CPI old
The GDP deflator includes all items that make up domestic products. It includes more than just consumer goods, so it’s a broader measure of inflation.
Nominal and Real Income
Nominal income - Today’s income is measured in today’s dollars. These are dollars unadjusted by inflation.
Real income - Today’s income is measured in base year dollars. These inflation-adjusted dollars can be compared from year to year to determine whether purchasing power has increased or decreased.
Real income this year = (Nominal income this year)/CPI this year (in hundredths)
Ex. →In 2014 Kelsey’s nominal income was $40,000, and it increases to $41,000 in 2015. Curious about her purchasing power, she looks up the CPI in 2014 and finds that at the end of that year, it was 234.8; at the end of 2015, it was 236.5. This is compared to the base year value of 100 in 1984.
Real income 2015 = $40,000/2.348 = $17,036
Real income 2016 = $41,000/2.365 = $17,336
Difficulties with CPI
Consumer substitute - As the price of goods begins to rise, we know that consumers seek substitutes. This substitution might make the base year market basket a poor representation of the current consumption pattern.
Goods evolve - The emergence of new products (smartphones) and the extinction of others (manual typewriters) is understood by firms and consumers, but the market basket must reflect this or it risks becoming irrelevant.
Quality differences - Some price increases are the result of improvements in quality. Prices that increase because the product is fundamentally better are not an indication of overall inflation. Since the BLS can’t tell the difference between quality improvements and actual inflation, the CPI can be overstated.
2.5 Costs of Inflation
Expected Inflation
When inflation is predictable, people can plan accordingly. The bank adds an inflation factor on the real rate of interest to create a nominal rate of interest that savers receive and borrowers pay.
Nominal interest rate = Real interest rate + Expected inflation
The real rate of interest - The percentage increase in purchasing power that a borrower pays a lender.
Unexpected inflation
Some people gain and others lose since there’s no time to plan.
Rapid unexpected inflation usually hurts employees if real wages are falling, as well as fixed-income recipients, savers, and lenders.
Rapid unexpected inflation usually helps firms if real wages are falling, as well as borrowers. It might also increase the value of some assets like real estate or other properties.
Costs of Inflation
Menu costs:
It results from firms having to change prices.
As inflation occurs, the price just skyrocketed and is placed in like a menu as a result.
Shoe-leather costs:
It refers to the time and effort that people end up spending to counterattack the effects of inflation.
Loss of purchasing power:
It occurs because inflation causes the value of the individual dollar to decrease over time.
Wealth distribution:
It involves the real value of wealth being transferred from one group to another.
2.6 Real v/s Nominal GDP
Real and Nominal GDP
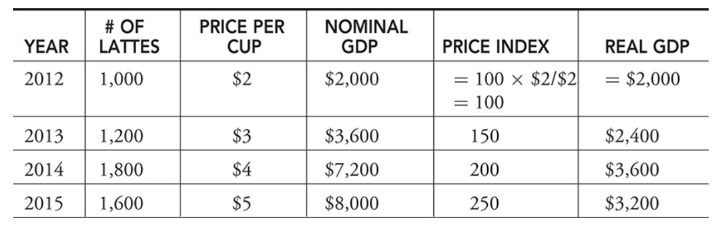
Nominal GDP - The value of current production at the current prices. Valuing 2015 production with 2015 prices creates nominal GDP in 2015. Also known as current-dollar GDP or money GDP.
Real GDP - The value of current production but using prices from a fixed point in time. Valuing 2015 production at 2014 prices creates real GDP in 2015 and allows us to compare it back to 2014. Also known as constant-dollar or real GDP.
To deflate the nominal GDP or adjust it for inflation, this division should be made:
Real GDP = 100 X (Nominal GDP)/(Price index)
Real GDP = (Nominal GDP)/(Price index; in hundreds)
Base year - The year that serves as a reference point for constructing a price index and comparing real values over time
Price index - A measure of the average level of prices in a market basket for a given year, when compared to the prices in a reference (or base) year. You can interpret the price index as the current price level as a percentage of the level in the base year.
Latte price index (LPI) example → Suppose GDP is made up of just one product, cups of latte. We need a price index to calculate real GDP. Using 2012 as the base year, a latte index is created and used to adjust nominal GDP to real GDP for this good.
LPI in year t = 100 x (Price of latte in year t)/ (Price of a latte in base year)
Using Percentages
% ∆ real GDP = % ∆ nominal GDP - % ∆ price index
If nominal GDP increased by 5 percent and the price index increased by 1 percent, we could say that real GDP increased by approximately 4 percent.
The GDP Deflator
GDP price deflator - The price index that measures the average price level of the goods and services that make up GDP.
2.7 Business Cycles
The business cycle - The periodic rise and fall in 4 phases present in economic activity. Can be measured by changes in real GDP.
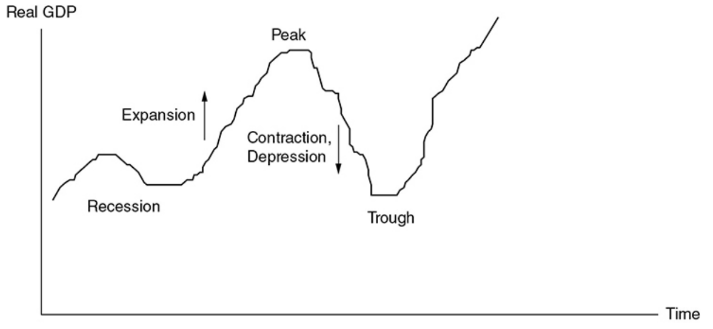
Expansion - A period where real GDP is growing.
Peak - The top of a business cycle where an expansion has ended.
Contraction - A period where real GDP is falling.
Recession - Unofficially defined as two consecutive quarters of falling real GDP.
Depression - A prolonged, deep contraction in the business cycle.
Trough - The bottom of the cycle where a contraction has stopped.