


Chap 2: Methods
Source: Barron’s AP Psychology
Research Methods
Hindsight Bias
People have the tendency upon hearing about research findings (and many other things) to think that they knew it all along.
Applied Research
Research conducted to solve practical problems
Example: Comparing two different study methods and their effects on grades
Basic Research
Explores questions that are of interest to psychologists but are not intended to have immediate, real-world applications
Example: Studying how people form their attitudes about others and how different cultures define intelligence
Hypothesis
States your predictions about what your research will find
The dependent variable depends on the independent variable. You can manipulate the independent variable to produce different results for the dependent variable.
EXAMPLE:
Hypothesis - watching violent television programs makes people more aggressive.
Independent variable - watching television violence
Dependent variable - the person’s aggression and behaviour
Theory
Systems of ideas that can explain certain aspects of human thoughts, behaviors and emotions
Operational Definition
A description of something in terms of the operations (procedures, actions, or processes) by which it could be observed and measured
EXAMPLE:
What programs will be considered violent? What behaviours will be considered as aggressive?
Validity
Measures what the researcher set out to measure; it is accurate
Reliability
When it can be replicated; it is consistent
Participants (Subjects)
The individuals on which the research will be conducted
Sampling
The process by which participants are selected
Population
Anyone or anything that could possibly be selected to be in the sample
When selecting a sample, you want it to be representative of a larger population
Random Selection
Every member of the population has an equal chance of being selected
Increases likelihood that sample will represent larger population
Stratified Sampling
A process that allows a researcher to ensure that the sample represents the population on some criteria
EXAMPLE: if the population is 300 African Americans, 200 Latinos, and 50 Caucasians, I would pick 60 African Americans, 40 Latinos, and 10 Caucasians.
Experimental Method
Laboratory Experiments
Conducted in a lab, a highly controlled environment
Main advantage is you can modify the extent to which they are controlled
Field Experiments
Conducted out in the world
More realistic
Preferred method of research is experiment
Only through a carefully controlled experiment can one show a causal relationship
Avoids as many confounding variables as possible
Confounding Variables
Any difference between the experimental and control conditions, except for the independent variable, that might affect the dependent variable.
Assignment
Process by which participants are put into a group (experimental or control)
Random Assignment
Participant has an equal chance of being placed into any group (limits participant-relevant confounding variables)
Differs from random sampling as random sampling is when you’re choosing participants from the population but random assignment is when you’re splitting the participants into groups.
Group Matching
Researchers attempt to categorize the subjects (by age, health status, gender, etc.) and ensure that the control group has members similar to those in the experimental group
Situation-Relevant Confounding Variables
The situations into which the different groups are put must be equivalent except for the differences produced by the independent variable in order to avoid this
Examples: time of day, the weather, and the presence of other people in the room.
Experimenter Bias
The unconscious tendency for researchers to treat members of the experimental and control groups differently to increase the chance of confirming their hypothesis
Double-Blind Procedure
Neither the participants nor the researcher are able to affect the outcome.
Eliminates experimenter bias
Most common way is for the researcher to have someone blind to the participants’ condition interact with the participants.
Single Blind Procedure
Only the participants do not know to which group they have been assigned.
Minimizes effect of demand characteristics and response or participant bias
Demand Characteristics
Participants use the cues about the purpose of the study to respond appropriately
Social Desirability
Tendency to try to give answers that reflect well upon yourself.
Hawthorne Effect
A type of reactivity in which individuals modify an aspect of their behaviour in response to their awareness of being observed
Placebo Method
Whenever participants in the experimental group are supposed to ingest a drug, participants in the control group are given an inert but otherwise identical substance
Allows the separation of physiological effects of the drug and psychological effects of people thinking they took the drug (placebo effect)
Counterbalancing
Using participants as their own control group
Using the entire group at once to do the experiment and control may lead to order effects
This can be eliminated by making half the participants do the experiment task first and half the participants do the control task first and then switching.
Correlational Method
Correlation
Expresses a relationship between two variables without ascribing cause
CORRELATION ≠ CAUSATION
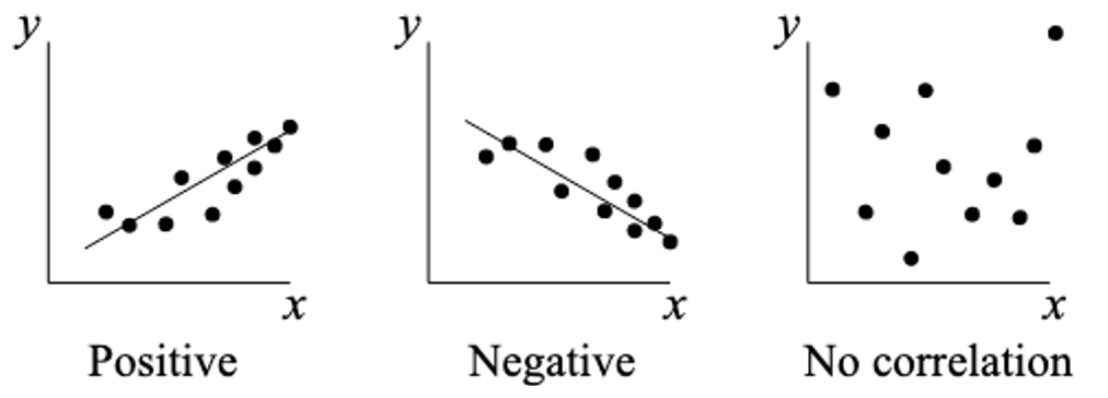
Positive Correlation
Presence of one thing predicts the PRESENCE of the other
Negative Correlation
Presence of one thing predicts the ABSENCE of the other
Ex Post Facto Study
Quasi-experimental study examining how an independent variable, present prior to the study, affects a dependent variable
Survey Method
The researcher does not manipulate any variable → only looking for a correlation
No control for participant-confounded variables
Usually low response rate
Naturalistic Observation
Observing participants in their natural habitats without interacting with them at all (unobtrusive)
Control is sacrificed to get a realistic and rich picture of the participant’s behaviour
Case Studies
Get a full, detailed picture of one participant or a small group of participants
While case studies allow researchers to get the richest possible picture of what they are studying, the focus on a single individual or small group means that the findings cannot be generalized to a larger population.
Statistics
Descriptive Statistics
Frequency Distribution
A tabular representation of the number of times a specific value or datum point occurs
Can be turned into frequency polygons (line graphs) or histograms (bar graphs)
Measures of Central Tendency
Mean (average), Median (middle), Mode (most frequent)
Can be distorted by extreme scores or outliers
When this occurs, the median is often used as a better measure of central tendency
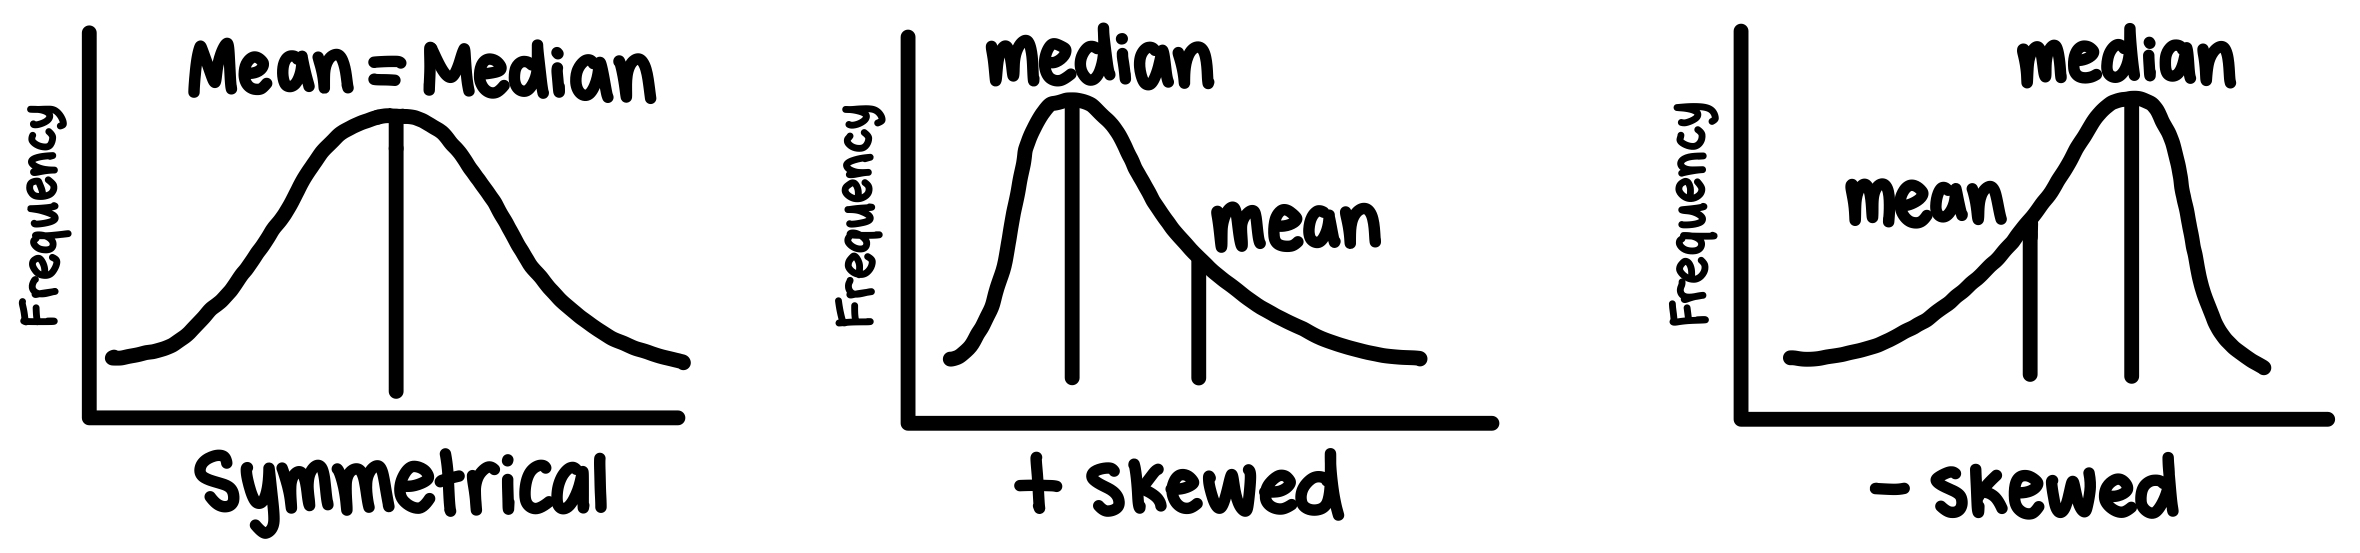
Skewed distributions are caused by outliers and the distribution curve is not symmetrical
Positively Skewed
Includes a high extreme score
More low than high scores
Mean is higher than median
Negatively Skewed
Includes a low extreme score
More high than low scores
Median is higher than mean
Measures of Variability
Range, Variance, Standard of Deviation
Depict diversity of distribution
Standard deviation = √variance
Both relate the average distance of any score in the distribution from the mean
The higher the standard deviation and variance, the more spread out the distribution
z scores
measure the distance of a score from the mean in units of standard deviation
Scores below mean = negative z score
Scores above the mean = positive z score
normal curve
68% fall within 1 standard deviation from the mean
95% fall within 2 standard deviations from the mean
99% fall within 3 standard deviations from the mean
Percentile
Measure distance of a score from 0

Correlations
refer back to correlational method for more info
Correlation Coefficient
Ranges from -1 (perfect negative correlation) to +1 (perfect positive correlation)
0 = no correlation
Correlations are typically graphed by a scatter plot
Line of Best Fit (Regression Line)
Line drawn through the scatter plot that minimizes the distance of all the points from the line
Inferential Statistics
Determining whether or not findings can be applied to the larger population from which the sample was selected
Sampling Error
The extent to which the sample differs from the population
Many different inferential statistical tests exist, such as t-tests, chi square tests, and ANOVAs
All take into account both the magnitude of the difference and size of the sample
p value
The probability that the difference between the groups is due to chance
The smaller the p value, the more significant the results
p value of 0.5 is the cutoff for statistically significant results
APA Ethical Guidelines
Any type of academic research must first propose the study to the ethics board or Institutional Review Board (IRB).
Animal Research
Clear, scientific purpose
Answer a specific, important scientific question
Animals chosen must be best-suited to answer the question at hand
Researchers must care for and house animals in a humane way
Animals must be aquired legally
Employ the least amount of suffering feasible
Human Research
No coercion
Participation should be voluntary
Informed Consent
Participants must know that they’re involved in research and give consent.
Participants may not be deceived about the nature of the study
Anonymity or Confidentiality
Privacy must be protected and identities/actions must not be revealed by the researcher
Risk
Participants cannot be placed at significant mental or physical risk
Consideration was highlighted by Stanley Milgram’s obedience studies
Debriefing
After the study, participants should be told the purpose of the study and provided with ways to contact the researchers about the results