


Chapter 13: Measuring and Evaluating Financial Performance
Objective 13.1: Describe the purpose and uses of horizontal, vertical, and ratio analyses.
Horizontal, Vertical, and Ratio Analyses
Horizontal analyses help financial statement users recognize important financial changes that unfold over time.
They compare individual financial statement line items (from one period to the next, aka horizontally) to trends.
These changes can be translated in dollar amounts or percentages.
Vertical analyses show relationships between items on a financial statement.
They are compared “vertically” by comparing the balance of one account to another.
Theses changes are translated as percentages.
Ratio analyses are used to understand relationships between items on one or more financial statements.
This analyses shows a company’s performance from using their resources.
An analysis is considered “complete” once it is successfully able to create a better understanding for those who review financial statement and its results.
Objective 13.2: Use horizontal (trend) analyses to recognize financial changes that unfold over time.
Horizontal (Trend) Computations
Horizontal (trend) analyses show how changes unfold over a period of time.
Significant changes are the focus.
It is also called the time-series analysis because of the comparison of results over a period of time.
Presented as year to year dollars or percentages.
Equation to calculate change (%):
(Current year’s total - Prior year’s total)/ Prior year’s total
Make sure to examine both the dollar amount and percentage to get your final results/conclusion.
Example: A company’s cash total in 2022 was $819 and in the previous year was $614.
(Current year’s total - Prior year’s total)/ Prior year’s total
($819 - $614)/$614
$205/$614
Cash had an increase of 0.334 or 33.4%
Objective 13.3: Use vertical (common size) analyses to understand important relationships within financial statements.
Vertical (Common Size) Computations
Vertical (Common Size) analysis focuses on relationships regarding financial statements.
It relies on percentages to translate results and relationships.
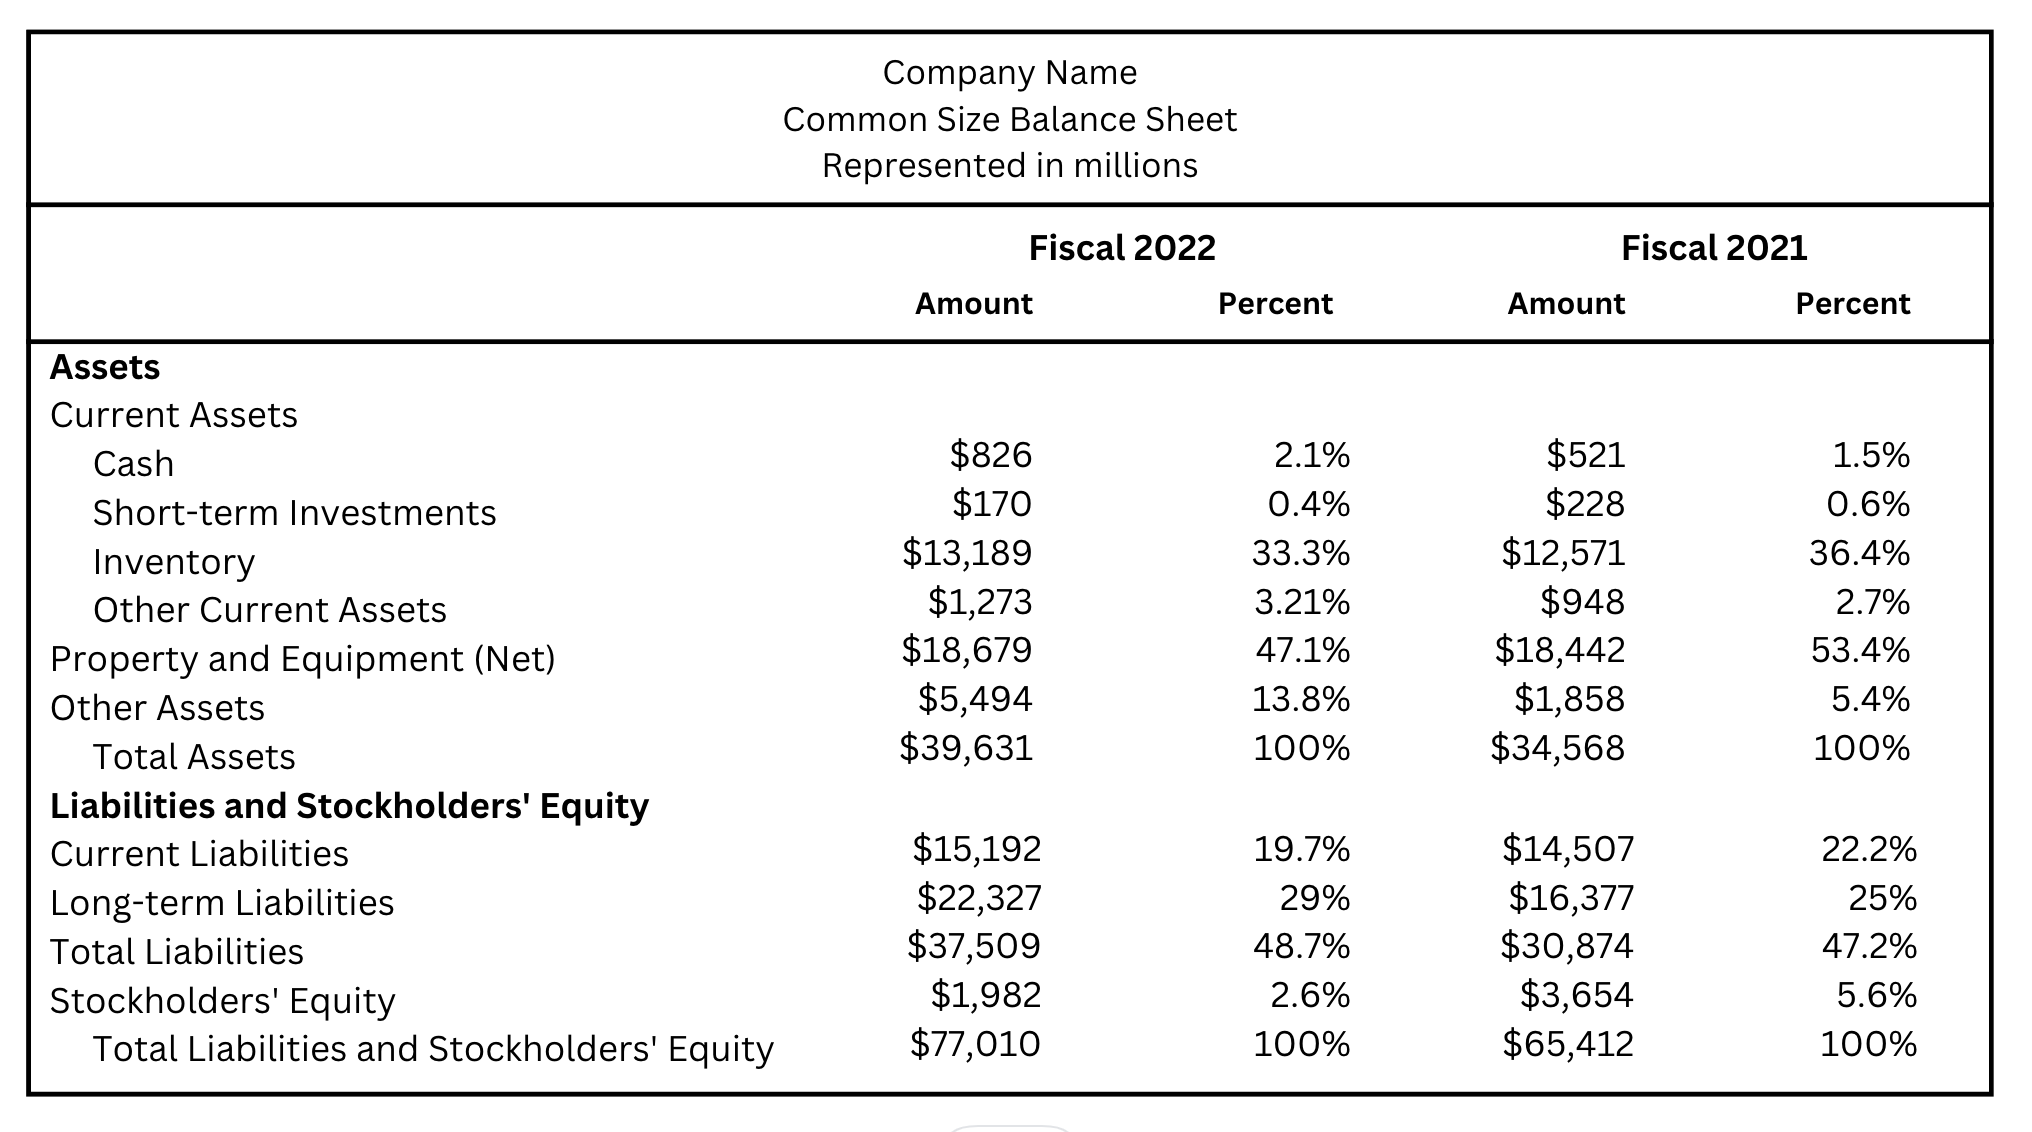
A common size balance sheet shows the percent of total assets and each liability or stockholders’ equity as a percent of their total.
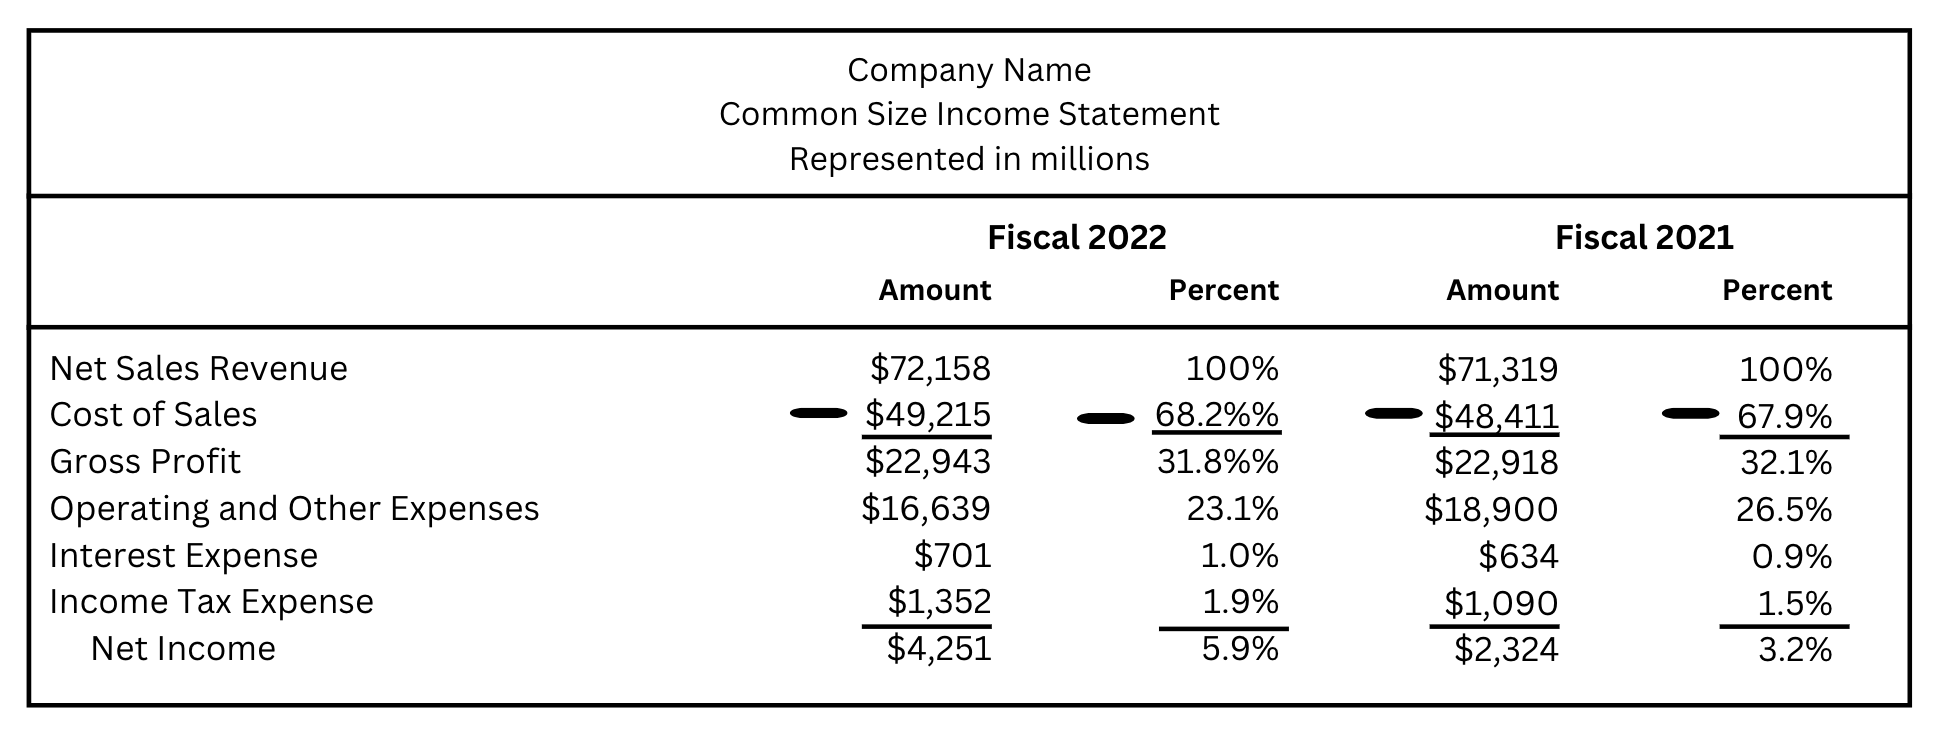
A common size income statement gives the percentage of sales for items on the income statement.
Objective 13.4: Calculate financial ratios to assess profitability, liquidity, and solvency.
Ratio Computations
Ratio analyses helps create a better understanding of relationships between line items on financial statements to other items within the same year.
Ratio analyses is similar to common size in the manner of how they both consider size in comparisons.
There are three categories of ratios:
Profitability ratios focus on a company’s net income within a current period.
Liquidity ratios indicate how well a company can use or sell current assets to pay the liabilities they have.
Solvency ratios assure that a company can repay lenders and interest payments.
Objective 13.5: Interpret the results of financial analyses.
Interpreting Horizontal and Vertical Analyses
A financial statement user should be able to view the statement, understand the relationships, activities, and overall results presented.
Financing for assets come from debt and stockholders’ equity.
Interpreting Ratio Analyses
It is important to compare your company’s performance to other years or companies.
By comparing, it helps see what companies will have a long life due to good performance or which ones will have a downfall.
All of the following equations are from past chapters, just categorized.
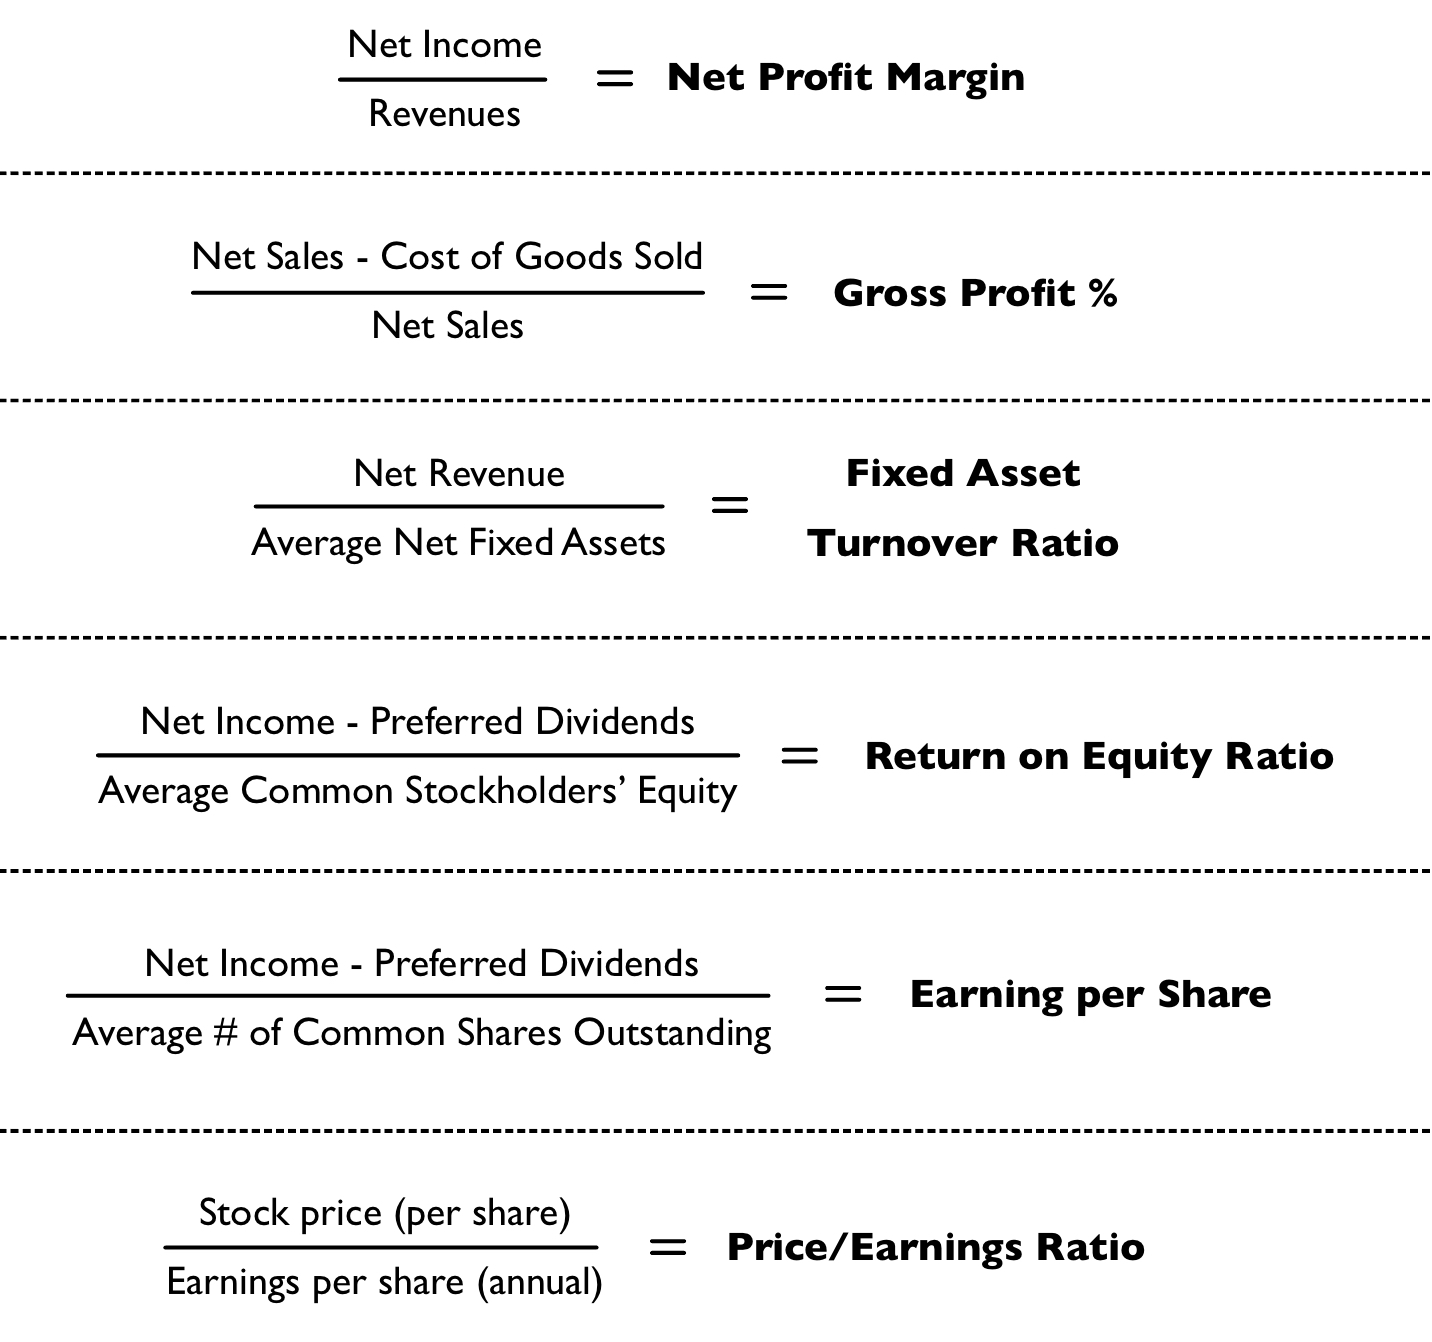
Profitability Ratios
Net Profit Margins help when evaluating a company and shows the percentage of revenue a company generates.
A gross profit percentage shows the overall profit made on sales.
The fixed asset turnover ratio tells us the revenue earned for the amount of money a company puts into fixed assets.
The return on equity ratio compares earned income for stockholders to the average amount of equity. It is reported as a percentage.
Earnings per share gives the amount of earnings from outstanding shares.
The price/earnings ratio correlates the stock price to the stock’s earnings per share.
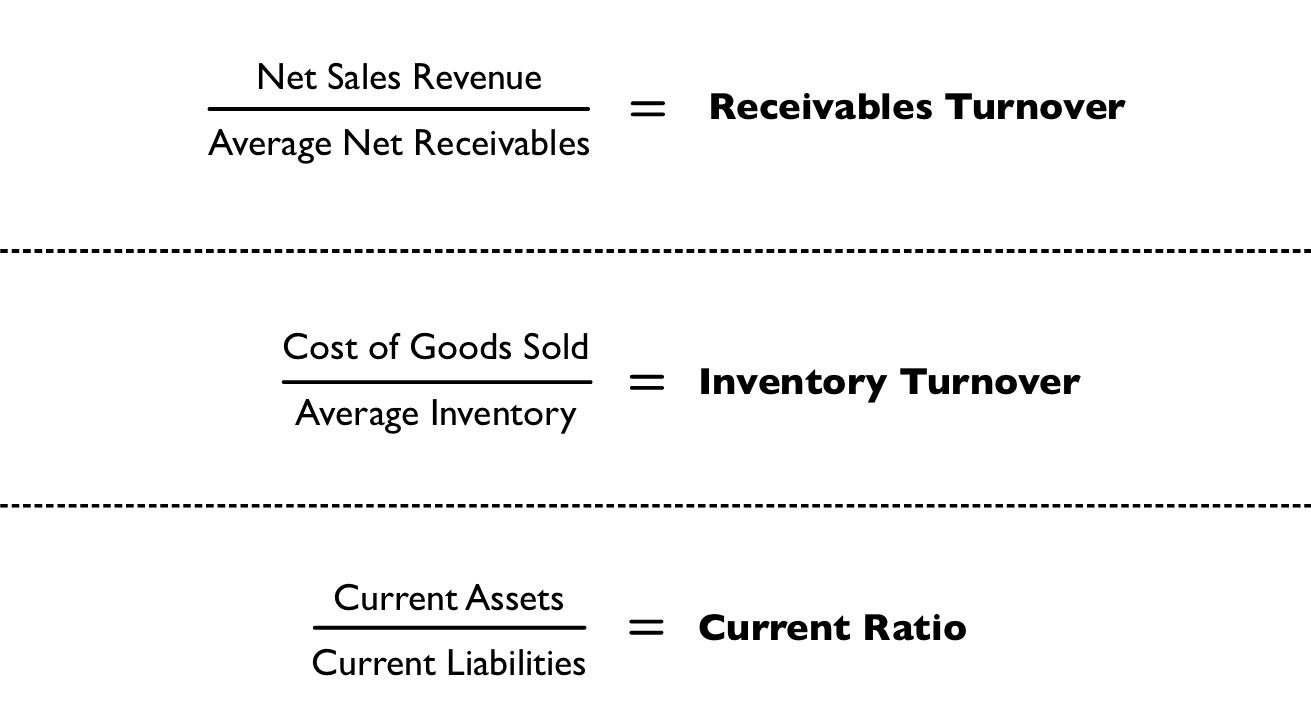
Liquidity Ratios
Each ratio correlates to seeing if a company can use assets to cover it liabilities.
The receivables turnover ratio indicates how well a company can collect on its receivables.
The inventory turnover ratio is the frequency of inventory being bought during the process of buying and selling items.
The current ratio compares current assets to current liabilities to see if those assets can pay the liabilities.
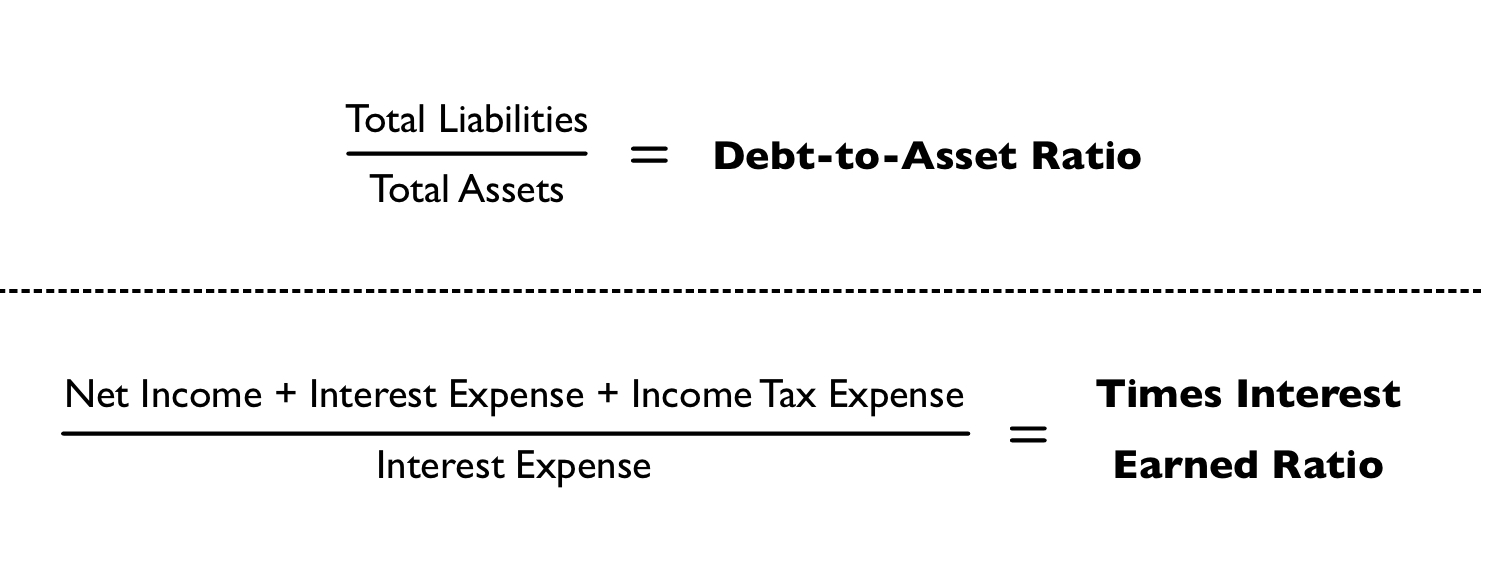
Solvency Ratios
The debt-to-assets ratio is able to show how much of a company is funded by debt and financed by creditors.
The times interest earned ratio indicates if a company’s current income can cover its debts.
Objective 13.6: Describe how analyses depend on key accounting decisions and concepts.
Accounting Decisions
Each type of ratio can give insight in how and why companies may make the decisions they do.
Different companies have different sales or services, customer demand, and policies.
Choice of method for certain aspects of business are different from business to business.
Accounting Concepts
Financial information communicates a lot about a company, so they must be reliable.
The full disclosure principle demands that all appropriate information regarding a business’s operations must be included on their financial statements.
The going-concern assumption lays out accounting rules. This is also known as continuity.