


Exam notes Data Analytics
CHECKLIST
- Types and purposes of qualitative and quantitative data
- Characteristics of data and information
- Sources, methods and techniques for acquiring and referencing primary and secondary data and information
- Interpretation of information for communication and decision making
- Factors affecting the quality of data and information, such as accuracy, bias, integrity, relevance and reliability
- Characteristics of data types and data structures relevant to selected software tools
- Procedures for the legal and ethical collection and use of data and information, such as using consent forms
- Techniques for protecting data and information from misuse, such as de-identifying personal data and the use of physical and software security controls
- Structural characteristics of spreadsheets and databases, such as cells, fields, records and tables
- Types and purposes of data visualisations suitable for educating, entertaining, informing and persuading audiences
- Functional and non-functional requirements of solutions, constraints and scope
- Design tools for representing the functionality and appearance of databases, spreadsheets and data visualisations, such as annotated diagrams and mock-ups
- Formats and conventions suitable for databases, spreadsheets and data visualisations
- Software functions and techniques for efficiently and effectively manipulating, validating and testing data to develop databases, spreadsheets and data visualisations
- Australian Privacy Principles relating to the acquisition, management and communication of data and information including non-identification of individuals (Principle 2), information only being held for its primary purpose (Principle 6) and the security measures used to protect personal information (Principle 11)
- Ethical issues arising from the acquisition, storage and use of data and information.
- Acquire and reference data and information from primary and secondary sources, taking into Account legal and ethical considerations
- Analyse the selected data, and discuss the relationships and patterns identified
- Interpret solution requirements, constraints and scope
- Interpret designs using appropriate design tools to represent the functionality and appearance of databases, spreadsheets and data visualisations
- Use software, and select and apply functions, formats, conventions, data validation and testing techniques to efficiently manipulate data and create data visualisations
- Compare and interpret data visualisations.
- Types and purposes of qualitative and quantitative data
Quantitative data is measurable and specific therefore, making it relatively easy to chart or graph. Quantitative data gathering is based on verifying a question through the use of statistics and data that is largely numerical. It can be analysed by using various software such as Excel and Minitab. This type of data can be used to capture a large sample and identify relationships but they do not provide for much depth and are at times superficial.
Quantitative data:
Disadvantages | Advantages |
|
|
Qualitative data is about qualities or attributes and is much harder to measure than quantative data. This type of data can be gathered using instruments such as interviews, focus groups, video footage and observation. Generally, qualitative data needs to be recorded accurately and transcribed. The analysis of this data is where the researcher looks for themes or patterns through the use numbers and establishes rich descriptions and classifies these themes. This type of data provides for rich, in depth studies of participants. They usually consist of a small sample size since it is not very random.
Qualitative data:
Disadvantages | Advantages |
|
|
- Characteristics of data and information
Data refers to the raw, unorganised facts, figures and symbols but it can also mean ideas or concepts before they have been refined. It can include text, numbers, sounds and images that are still or moving.
Information is produced when data is manipulated into a meaningful and useful form. Usually achieved by organising the data and presenting it in a way that suits the needs of the audience. It is made with the purpose of informing, entertaining or persuading an audience.
- Sources, methods and techniques for acquiring and referencing primary and secondary data
Primary sources of data provide a firsthand account of a person, object, events or phenomena and is collected by the investigator themselves. On the other hand, secondary data is data that is collected by someone other than the user and is being utilized for the project.
Collecting data is usually done through methods such as surveys and interviews – easy to present graphically but also require analytical discussions to interpret. Surveys contain a range of questions and participants may answer by selecting a response (multiple choice or scale), or in short or extended text based responses. Interviews are conducted face to face and there is opportunity for in depth follow up and clarification – very useful for eliciting feelings, attitudes and opinions.
Surveys – common method, quick way of gathering large amounts of data and must be carefully worded to provide meaningful and useful data. The following details must be documented to properly reference the survey:
- Name of the respondent
- When the survey was completed
- Title of the survey
- Organisation to which the survey belongs
- How it was conducted
Focus groups – meeting of a small group of individuals who are guided through a discussion, carefully selected for the demographic, obtain the necessary data to find attitudes, loosely structured.
Interviews – used to elicit people’s opinions and beliefs, recordings are research data but can be transcribed (structured, semi structured, unstructured interviews), include closed and open ended questions. The following details must be documented to properly reference the interview:
- Name of interviewee
- Date of interview
- Place of interview
- Qualification to be an interviewee
- Organisation to which the interviews belong to
- Contact information for interviewee
- How it was conducted
- Name and contact details of interviewer
Observation – way of understanding the world, selective about what we perceive to be most useful, make careful notes, record all accounts, researcher approaches participants in their own environment. The following details must be documented to properly reference the interview:
- Name of the person or group being observed
- When the observation was conducted
- Where the observation was conducted
The purpose of referencing sites is because it helps to establish that the data comes from a real source and in order to ensure that the data is from a reliable source. It provides authenticity for the work and for the data. Referencing also acknowledges international copyrights such as plagiarism and the ability to own one's intellectual capacity.
- Interpretation of information for communication and decision making
Data and information can be collected, stored and interpreted for a particular purpose. The findings may be of significant benefit to the participants or their relatives. The purpose of spreading outcomes from the interpretation of the information is to make a contribution to knowledge. Furthermore, the interpretation of finding assists with decision making to better inform people about options available to different problems or issues.
- Factors affecting the quality of data and information
Relevance – to produce usable information the data must be relevant (appropriate to the discussion) and it needs to be processed while it is current because decision making should be made based on current data not out-dated data.
Accuracy – data that is collected must be accurate (correct in all details and free from errors) otherwise the insights will be poor and decisions based on this data could case integrity issues. For example, transcription is often a cause of error and it can be caused by a lapse in concentration, being interrupted or pressing the wrong key. It is easy to make a mistake when entering large amounts of data particularly numbers – if the data entry is incorrect then the information produced will be incorrect too. Verifying data can help to ensure accuracy.
Freedom from bias – Bias is prejudicial or unreasoned judgement. There are several influences that can lead to introduction of bias into data; vested interests, timing and small sample sizes. Bias can enter data if the respondent has been influenced or has a vested interest in the outcome of the research. The timing of the data collection could also introduce bias if certain events prompt a particular view of an event used for data collection. A small sample size can lead to increased possibility of bias within and may not take into account certain people. Bias through sorting refers to the way in which you sort lists but is usually unavoidable. Bias in graphic representations refer to the effect of the choice of typeface or the scale or size chosen for graphics. It could be sized proportionally to overstate or trivialise the importance of particular variables
Reliability – the sources in which data is gathered from must be reliable which means they must be able to be trusted.
Data Integrity – refers to the quality of the data which is important since the data input must have integrity. The more errors the data set contains, the lower its integrity.
Usable data must be relevant, accurate, free from bias and reliable. The data must be relevant to the study and it must be processed while it is current because decision making based on the data should be based on current information rather than outdated information. Data collected must be accurate otherwise will be poor and decisions based on this data could cause integrity issues. Bias can easily influence data and make it unreliable since it affects the overall outcome. Reliable data means that it should come from respected sources which are likely to provide accurate and correct information. Data needs to be processed while it is still current because decision-making should not be based on outdated data. The timeliness of data is extremely important and is reflected in companies which need to publish their quarterly results, customer service who need to provide up-to-date information and the credit system which needs to check on credit card account activity.
If the information is derived from incorrect or incomplete data then it will become an unreliable and inaccurate source of data. Any decisions made from this unreliable source will lead to questionable decisions being made by those who rely upon the data in order to manage their decision making.
- Characteristics of data types and data structures
The term data type is a particular kind of data item or an attribute of data which is defined by the values it can take and informs users how the information is intended to be used.
Data type | Description | Example |
Text | It consists of a 'string of characters' which means that it can hold a mix of characters including letters, number and special characteristics. Therefore, this field is alphanumeric. | Names of people, addresses, phone numbers, ID codes, postcodes |
Character | This means that it holds a single letter, number or symbol. It is used when there are multiple options for a value but they can be represented with one letter to make data entry easier and save data storage. | Sizes of clothes - S, M, L, XL |
Integer | An integer is a whole number meaning it is without a fractional or decimal component including negative numbers. | Anything number such as 108769 |
Decimal | Also referred to as floating point numbers which are numbers with a fractional or decimal component. | Money - $31.32 |
Boolean | This data type means that it represents one of two possibilities; true or false, yes or no | Can be used in logical tests such as do you have a pet |
A data structure is a particular way of organising a collection o data items and by using them it helps to improve the efficiency of the data-handling process. There are three common data structures; arrays, records and files.
Data type | Description |
File | A file data structure can hold numerous data items, arrays or records. A file is saved separately from the software program that utilises the file and large data sets can be read from, or written to, or file for storage purposes. Comma separated values (CSV) files are common since they easily allow data to be sent from one place to another without majorly disrupting the data and is compatible with many software. |
Array | An array is a collection o data item and usually of the same data type. Each item located in an array is called an address. |
Record | A record is a collection of data items of different data types and each element that is recorded is generally referred to as a field. |
- Procedures for the legal and ethical collection and use of data & information
Participants in any research need to be informed about what the research entails – what they’re required to do, how much time it will take and how often they will be required – this provided so that they can make an informed decision as to whether they will participate.
The informed consent is described in ethical codes and regulations and it's goal is to provide sufficient information so that the participant can make an informed decision about whether or not to enrol in the collection of data. If this is unknown to the participant then it risks an infringement of their rights. This means that before agreeing to participate they are ware what it involves, the time required from them and any risks that may arise especially since this is voluntary. The most common way to obtain informed consent is through a participant information statement along with a consent form.
- Techniques for protecting data and information from misuse
When undertaking research it is important to uphold the privacy of the participants – this is affine a balance between their interests and those of the researches. The problem usually lies with how the data is used or misused by people entrusted with it and in order to maintain privacy and to de-identify (remove information from data so an individual cannot be identified), personal identifiers such as names and birthdates need to be removed. This can be done by anonymising the data, pseudonymization of data (mask personal identifiers), generalisation of data and providing consent and ability to opt out of the survey or process.
Physical security measures may include physically ensuring that computers or any way to access the protected data is securely stored away. Certain measures may include employee swipe cards, logs of staff movements, security and alarm systems to control entry to the workplace.
Software security tools include encryption and backups. It is very important to secure data when conducting research because if any data of any participant is leaked then it is an ethical issue. All people have the right to have their information remain private and if this right is not upheld during the course of researches then certain ethical principles will be violated.
Encryption is the process of translating data into a code that can only be read by authorised users and must have access to a secret key that you use to decrypt the data. Encryption is highly important because it allows you to securely protect any information and data that nobody else should have access to or any data that relates to other people which would violate their right to privacy. Any sensitive information such as credit card numbers, personal details, tax histories, emails are all protected through encryption to ensure that no access is granted to those people who may not use them wisely.
Backups are an essential step in data management and any critical data files or data should be backed up frequently so that important files are not inadvertently lost and privacy is then compromised. Backups are an essential form of data management and regular backups can protect against a variety of risks including human error, computer crashes and software faults. A full backup is the copying of all files from a device to a storage medium and it can take a considerable amount of time. An incremental backup on the other hand is that it uses more than two backup media and it only copies files that have been changed since the last time there was a backup. Furthermore, a full back up only occurs once over a period of time. Whereas, incremental backups take much less time since there are only certain files that need to be copied. There are various ways in which your data can be backed up. The files can be located inside a physical structure or feature such as a safe or it can be stored in the cloud. Cloud computing services provide offsite storage, processing and computer resources to individuals and organizations. Furthermore, this data can be accessed from anywhere at any given time.
Password and username protection is a highly common security process that protects information accessible via computers that need to, in turn, be protected from unwanted users. It allows only those who are aware of the authorized passwords to make any changes and have access to certain information. Usernames are also uniquely assigned to users meaning that they are usually identifiable as belonging to a certain person and can be easily remembered. There are certain key elements to having a strong password. The key aspects include the length of the password; the longer the better. Moreover, the use of a variety of different characters such as symbols, upper case and lower case letters and numbers. Furthermore, if the password has no personal connection to you and has no dictionary words it can be even stronger and make it harder to be hacked into.
Firewall is hardware and software (a server and software combination) that restrict access to data and information on a network. The filters used by a firewall may include examining the IP address of computer that request information, blocking all access to certain domain names, banning certain protocols from accessing particular servers and searching for certain words and phrases included in information and blocking transfers that contain them. Essentially it controls incoming and ongoing network traffic and intrusion prevention and detection systems.
Malware protection is used to prevent any malicious software including Trojans, spyware, adware and any worms or viruses. The antivirus software is often updated automatically via the network and is useful to block malware from sending personal information over the net.
Whitelisting and blacklisting are ways of controlling the content, applications or entities that are allowed to run on, or access a device or network. A whitelist is those programs and IP addresses that are permitted to access and anything not on that list is blocked. A blacklist, on the other hand, is a list of those entities that may not access your system. They work together to prevent unsafe material from accessing your system.
- Australian Privacy Principles relating to the acquisition, management and communication of data and information including non-identification of individuals (Principle 2), information only being held for its primary purpose (Principle 6) and the security measures used to protect personal information (Principle 11)
The Australian Privacy Principles affect individuals because it is their data and information that is available on different platforms. This also gives organisations the flexibility to tailor their personal information handling practices to their business models and needs of individuals however, the data must still be protected according to the principles. The Privacy Principles fall under the Privacy Act 1988 (Commonwealth) this was amended in 2012 to include the privacy principles.
Principle 2 – Provides individuals dealing with organisations the option of using a different name or pseudonym. De-identification aims to allow data to be used by others without the possibility of the user being identified from the data. It protects the privacy of individuals, organisations such as businesses and ensure that the location of certain things are not publicly available. It is also used to protect people and preserve the privacy of research participants.
Principle 6 – States that the information being held is for the primary purpose it was intended for and it cannot be used for a secondary purpose unless the holders have received consent to do so.
Principle 11 – refers to measures taken to actively secure personal information held and also considers whether those who hold this personal information are permitted to retain it. Reasonable steps need to be taken to protect information from misuse, interference and loss through unauthorised access, modification or disclosure.
- Ethical issues rising from acquisition, storage and use of data and information
An ethical dilemma is described as being cases where societal and personal ethical guidelines can provide no satisfactory outcome for the chooser. In context of data collection for research purposes informed consent is a major ethical issue and the respect for anonymity and confidentiality as well as the respect for privacy. There can be issues of confidentiality since they cannot reveal any information even though it might be needed to. Furthermore informed consent can also be an issue if the person needs information but if it is for the sake of a research there may have to be some information withheld which can cause conflicts.
- Structural characteristics of databases and spreadsheets
A spreadsheet is an electronic program and is a file made of rows and columns that help to manipulate and calculate as well as view and record data. The main structural characteristic of a spreadsheet is the cell which is the intersection of a row and a column holding one item of information. An arrangement of cells is usually a table.
Function | How to |
Multiply numbers | Write an equal symbol then select first number. Then press shift and 8 and select second number. Press enter. Click black dot and drag to apply same function to others |
Save | Press control and s. |
Add adjacent numbers. | Select a cell and press auto sum (top right corner of page). Press enter. |
Add cells that are not adjacent. | Type in =SUM(…..) and inside the brackets add the cells you want to sum or tap the cells you want to sum. Looks like =sum(G2,H4,I7,J9:J11,K13) |
Find median | Click the cell, type in =median(and select the cells required) |
Absolute cell referencing | Place cursor behind the number you want to keep and press function (fn) and f4. Cell reference should have dollar signs. Eg. $G$9 |
Percentage button | When using percentage button in centre top of page, know it will multiply by 100. |
Date | Type =now() and the date will always update. |
Formatting Cells | Right click on a cell and in the drop down menu there will be a format cell button You can format cells according to many categories |
Validation | To validate a cell you must first click on the cell, go to Data on the tab, find data validation and write the restriction as well as the message you want to display |
Protection | Select all the cells that you don't want to make protected and format them so that the locked box is unchecked all of the cells then protect the document in the Review menu |
To select | Control + Shfit and then you can go up or down accordingly |
Create drop box menu | Write down the values in each cell on top of one another, then select data validation for the cell you require. Then click on list and select the range - this will create a drop down menu. |
Join text and word in cells | Use the & sign and any required text in "" marks eg =F3&"is good". Also see the concatenate page |
Median | =MEDIAN( number 1, number 2…) |
Average | =AVERAGE(number 1, number 2…) |
Sum | = SUM(number 1, number 2…) or = SUM(C7:D5) |
Max - Min | =MAX(number 1, number 2…) |
Hour | =HOUR(D5 (assuming that D5 is in 24 hour time) |
Conditional Formatting | Conditional formatting, new rule, cells that only contain and then make sure to select a format |
IF Function | =IF(condition, value if true, value if false) |
IF OR Function | =IF(OR(conditions)), value if true, value if false) |
IF AND Function | =IF(AND(conditions)), value if true, value if false |
A database is an organized collection of data and information and it's primary purpose is to keep all information easily accessible and to stay organized. It is used to store and retrieve information in a way that is accurate and effective. The main components of a database are tables, queries, forms and reports. Fields are a piece of information related to a single particular thing. The table component in Access is where the raw data is stored and it contains fields. Forms is a place to key in data and open records by using the table. A query answers questions about your data and can help to sort and filter accordingly. Reports are a paper document that is professional looking and its purpose is to present the information. A record is composed of a set of related fields and contains all the data about one particular person, company or item in a database. Therefore, a record is a complete set of fields. A field is a part of the record and contains a single piece of data for the subject of the record. Fields usually appear as columns in a database table. Fields can also vary in length depending on how much data needs to be placed into it.
- Types and Purposes of data visualisations
Data visualisation refers to the representation of information through the use of software tools to access and select data in order to present it in a graphical form. This can be in the form of histograms, bar charts, maps, spatial relationships and network diagrams. The purposes of data visualisation is to assist the viewer in identifying patterns and relationships in large amounts of data that would've otherwise been difficult to identify. Moreover, it's purpose can also be to educate and develop understanding, entertain and amuse persons, to distract or provoke a response from a viewer, inform persons or to persuade people to consider a point of view or opinion.
A chart is a method of displaying information and data visually where it is represented as symbols in the chart. They are often used to visualise numerical data and there are a range of chart types such as histograms, bar charts and line charts each with differently suited purposes.
Maps are the most popular method of displaying geographically related data and is also used to then analyse and display geographical related data. It allows to visually see the distribution or proportion of data in each region in a way that is clearer and more intuitive to understand for people.
Networks are used to show the relationship between two data entities or two different data sets in order to identify their correlation through the use of links and nodes. It's intuitive and easy to understand even to people who've never used this form of data visualisation before, it's insightful through interactive data analysis to gain deeper knowledge and allows to simplify complex content. Network visualisations are used to show and highlight relationships between different data items and relationships between two different data sets to identify whether or not a correlation exists. It illuminates the relationship between entities and this vivid display can emphasise any discrepancies that may otherwise have been overlooked. Network visualisations could be used to identify the number of people who travel on public transport each day or the represent the layout of computer networks and public transport systems.
A flow visualisation involves the representation of data that illustrates the flow pattern of one or more data items. This could be a variety of things such as the pattern of customer movements through a supermarket where the most fish are around the world. Moreover, they can be used for scientific purposes to visualise the flow patterns of objects that are usually invisible such as air.
Geospatial visualisations is a popular way of conveying information relating of geographical data. This data could be related to populations, roads, rivers, climate, mobile phone towers or any other characteristic of that particular geographical location. They are a very useful and powerful tool to bring the data to life through the visualisation. Through geospatial visualisation it can be made much easier to show and correlate different variables to geographical locations. A significant advantage of geospatial visualisations is that they can be overlaid with a geographical location map or other types of maps. Thus, making it useful for many different purposes and for many different people such as, agricultural, environmental and mining purposes. Furthermore, this provides people in industries that require maps to be able to more easily understand the distribution of a presence across many countries as well as to compare these accordingly.
Time visualisations represents a data item or data set over a period of time – timeline data may relate to individual items or events and show the order in which the items or events occurred and time series data may relate to the same data item and show the variations or changes in the item over a time period.
Matrix visualisations can be used to show the composition of individual items in the sample size by dividing the display area up into grids and different sections of it are used to represent that portion. They can be used to compare different data items.
Dynamic data visualisation is where the appearance of the infographic can be changed by the user selecting alternate views. This can be done up updating the data so that the latest information can be included.
- Functional and Non-functional requirements, constraints and scope
Functional requirements refer to what the data visualisation should do; typically, they will describe a behaviour or a function.
Usability – all graphic solutions that represent data should be easy to use, flexible and robust and the user should be able to acquire the required information easily and efficiently.
- Can the user understand the graphic form and the information it conveys?
- Can the user quickly identify the purpose and interpret the critical data?
- Is the graphic form accurate and a true reflection of the data that has been analysed?
- Is the final data visualisation in a format that maximises the legibility and in a size that is quick to load?
- Are sensible dimensions been implemented?
- Are the font sizes easily readable?
- Does it work in multiple browser sizes effectively and to the same standard?
Accessibility – A user should be able to access meaning and relevant information from a graphic solution easily and efficiently. Users should not be confused by the meaning of or the placement of texts and symbols and simple, relevant and commonly used labels must be applied. The user should be able to navigate their way through text and images in a standard way.
Non-functional requirements describe how the data visualisation appears rather than what it does.
Alignment – refers to arranging the text, images and objects vertically or horizontally in either straight lines or correct relative positions. Using alignment cleverly gives your text, images and objects a sense of order and organisation that helps to clearly communicate the message.
Repetition – refers to the use of same or similar visual elements repeatedly within a graphic solution. It is used to unify elements of a layout and on a graphic solution it usually means that each section or module uses similar elements. This makes it easier for the user to understand the relationships when switching between elements of a solution.
Contrast – refers to the visual difference in colour or tone between objects; text and images. Greater contrast will make objects appear to stand out more from one another. If there is not enough, then they may appear to blend into each other and make it difficult for the user to see clearly. Contrast allows to make the information clearly visible and legible.
Space – refers to the areas around and between the objects; if it is too cluttered then it may be difficult to follow. There must be enough to space to distinguish between objects and to allow them to be navigated through in the correct order.
Balance – refers to the symmetrical arrangement of items so they appear to be balanced left and right. All elements of a layout have a visual weight. If the elements on either side or the top and bottom of the screen are of an equal weight then visual balance is achieved
A constraint is a factor that limits or restricts the data visualisation and can be broken down into economic, technical, social, legal and usability. There are two main categories; technical (economic and technical) and non technical constraints (social, legal and usability).
Economic constraints are to do with time and budget which means that either a lack of time or a small budget can impact on the solution. This can result in the re-evaluation of the user's requirements, or how much of the solution can actually be achieved. The deadline by which the solution needs to be made means that there could be restrictions as to how much design and development will be able to be done in that time thus, the longer the time available the more time there is to complete an in depth analysis and detailed design.
The technical constraints related to the hardware and software available for the project and for the solution. Factors such as the available hardware, software capacity, memory and storage capacity, processing and transmission speeds. These factors can impact on the ability of a solution to be fully complete without any gaps in the data sequence.
Social constraints refer to the level of expertise of the user to be able to use the data visualisation effectively and users with little digital systems expertise may restrict some of the requirements that would involve complex manoeuvres to complete.
When considering usability , all visual solutions that represent data must be easy to use, flexible and robust which means that the user should be able to acquire the required information quickly and easily. If the solution is difficult to use then it will not be beneficial to the user and this means that the factor of usability must be considered as a constraint on the solution. It cannot involve overtly complex processes that would restrict usability.
Legal requirements are another type of non-technical constraint. Privacy laws, for example, may restrict features linked to displaying personal data in a solution or to collecting data from the devices of someone using your solution. Moreover, copyright laws may restrict features that allow other users to upload content to the solution. These legal factors must be considered when designing and creating an appropriate solution.
The scope of a solution refers to the work that must be done in order to complete the solution. Scope will be informed by the functions and features of the solution. Scope is documented in a scope statement in order to make decisions along the process of developing and managing the scope is about what is and what is not included in the solution.
- Design tools for functionality and appearance
The purpose of a design tool is to represent either the functionality or appearance of the data visualisation solution and they are meant to influence the process of production, expression and perception of design ideas as well as the overall outcome. Design tools, overall, are used to represent functionality or appearance of the solution that is being created. Appearance design tools include layout diagrams, mock ups, story boards and annotated diagrams. Functionality design tools include IPO (input - process - output) charts and flowcharts
Appearance design tools main purpose is to outline and help to determine the appearance of your solution. Layout diagrams (can be either handwritten or computer generated) can be used to plan out how the visualisation will appear and its main purpose is to illustrate how the final solution will look and it can assist in determining if the visualisation will be appropriate for the data set. A number of layout diagrams can be created to represent the data set in a variety of types of visualisations to help decide on the final version. Annotated diagrams and mock ups serve the same purpose in that they aim to provide a visual depiction of how your solution should look. These designs indicate features such as the difference in text sizes, fonts, colour and positioning as well as he positioning of objects. An annotated diagram and mock up should clearly indicate the types or shapes of graphic solutions, titles and layouts of the diagram and formats and conventions used in the solution. They can be a wire frame or a mock up; a wire frame is a rough sketch drawn to provide layout information whereas a mock up is much more detailed providing format information to create the final solution.
Functionality design tool IPO charts is used during the design stage of the problem solving method to clearly identify the solution's input, output and the processing steps required to transform the data into useful information. The purpose of an IPO chart is to get a sense of how much formula development work might need to occur during the manipulation stage of the solution and to show how data is processed into meaningful information. Flowcharts are there to provide a visualisation of the procedural stages that must need to be completed for the entire solution to work. Storyboards can be used to demonstrate how a dynamic data visualisation may be animated or updated as well as address how user interactions may affect it. They can show the interconnectedness of a dynamic solution which is why it is considered a functionality tool.
- Formats and Conventions
Formats are related to things that can be changed or formatted according to the users preference including things such as the font type, font size and colour, as well as the background colour and other tools of appearance. Conventions, on the other hand, are general and traditional rules that are followed when using a particular tool. Examples of conventions include, making column headings bold and having text left aligned and numbers right aligned
The overall aim for any spreadsheet is to have clarity of a purpose when creating workbooks, sheets and components within a sheet. A useful convention for spreadsheets is to name sheets with descriptions of their purpose as well as clearly labelling or indicating all units and denomination. Moreover, it is a convention for the data to be aligned with the same type consistently down rows and across columns - text is aligned to the left and numbers are aligned to the right. Aligning data with the same type consistently down rows and across columns is also important as well as considering how many decimal places etc. Another convention to be considered is that if you are developing advanced interactive models then range naming prefixes should be used. Some formats could be using fill colour to define areas or sheets or to indicate the content of a cell.
The formats and conventions for databases is not so easily defined however the most basic rule is that they must be easy to use and predictable. Some of the most common conventions is to develop a pattern and apply the rules consistently to tables, views/reports, columns and keys. Moreover, it is accepted that all files are appropriately and consistently named either in Hungarian notation, camel case or c-style naming. Filenaming is very important and for data bases camel case is a simple naming convention used. The formatting component can be through the way reports are arranged and the layouts are used.
For data visualisations it is important to follow the convention of having a meaningful title that is concise, to the point and easy to understand as well as making an impression and indication as to the data involved. It is also important that if there are any charts involved there should be clearly labelled axis to provide better understanding of the meaning of the axis and include units or denominations for better completeness of data. Moreover, for charts, the axis values should begin at 0, sources should be cited and simplicity over complexity. A normal convention is to provide the source of the data as well to ensure that data authenticity is achieved since the data has been collected from a reliable source. Moreover a general convention is that the data visualisation should have easy to read texts and text colours which easy to read and contrast so that people are able to read the text as well as then to contribute to their understanding of the data. A format that should be considered is text styles (font); times new roman (usually used for body text or long passages), Arial (short paragraphs, large headings) and courier new (ensure legibility and unmistakable). Another format is the lines and arrows used in a graphic solution – bold lines draw emphasis whereas fine lines can suggest technical details.
- Software functions and techniques for effectively manipulating data
Extracting data means to obtain relevant data from data repositories such as databases and spreadsheets.
Spreadsheets – The data sets extracted from sources are usually CSV (Comma separated values) files and compatible with current spreadsheet software. Spreadsheet contains a web query which allows data to be acquired from online data sources but there is a limitation in that the spreadsheet software needs to recognize the data.
Database – particular software can be used to acquire data from data sources where the data can be imported from a range of sources and file formats.
Programming languages – some programming languages have the capacity to extract data from external data sources. For example, Python can extract data from websites and so applications that use python can do this based on the HTML code.
Validation is what is used to make the solution more accurate by making the data inputted reasonable. This means that all data entered should be checked for any illegal data types, for reasonableness, for correct spelling and to ensure that data falls within a correct or reasonable range. Since it is easy for data entry errors to occur, there should be precautionary measures taken to ensure that the data is more reasonable and thus make the solution more accurate. There are a number of ways to do this through databases and spreadsheets;
- Range check
- Create validation rules along with warnings about certain data fields
- Drop down box
- Form control – validate data entry by reduction in typing errors
- Limiting the amount of numbers - field size
- Input masks
- Lookup field
- Required field
- Filtering – cause empty fields to be found and dealt with accordingly
- Evaluating databases, spreadsheets and data visualisations with criteria and strategies
Evaluation involves measuring how well the solution meets the information needed and the needs of the client.
Evaluation criteria are measures that will be used to determine whether the solution meets the information needs of the client. This relates to the initial solution requirements because it must be determined if the information need has been met, moreover, the criteria should be quantifiable and measurable. This might include:
- Effectiveness criteria to see how well the solution works and if it provides the information necessary
- Efficiency criteria to see whether it saves time, cost, effort when retrieving x
On the other hand, evaluation strategies involves deciding how each evaluation criteria can be measured which can include deciding on the data required to help judge each criterion and look at the way it will be used to evaluate each measure. Methods for displaying evaluation strategies:
- Using one criterion for effectiveness and for efficiency related to the same thing being evaluated
- Use interviews, surveys and observations to check
- Check download speeds
- Counting website hits
- Inspecting solution output
- Reviewing error logs
- How long it takes for users to complete tasks or find information
An evaluation report involves stating whether the solution is meeting the information need and the needs of the user. To provide evidence for the final conclusion, each evaluation criterion must be assessed to identify whether it has been achieved. If they have, then it is considered a success.
CHECKLIST
- Functions and capabilities of key hardware and software components of digital systems required for processing, storing and communicating data and information
- Characteristics of data types
- Types of data structures
- Design tools for representing the functionality and appearance of solution designs such as data dictionaries, mock-ups and pseudocode
- Naming conventions for solution elements such as files, functions, methods and variables
- Processing features of a programming language
- Characteristics of internal documentation
- Formatting and structural characteristics of input and output such as file formats
- Testing and debugging techniques to ensure software solutions meet requirements such as test tables and test data
- Techniques for evaluating the efficiency and effectiveness of software solutions
- Project plans to coordinate and monitor the tasks, including sequencing and time allocation to create software solutions
- Analyse solution requirements to develop a software solution
- Select and use appropriate design tools to represent solution designs
- Use a range of data types and data structures
- Develop a software solution using appropriate processing features of a programming language
- Design and apply suitable testing and debugging techniques using appropriate test data
- Evaluate the efficiency and effectiveness of the software solution to meet requirements
- Document and monitor project plans using software
- Functions and capabilities of key hardware and software
Information systems compise people, data, processes and digital systems.
- People, who interact with systems according to their needs, such as programmers, data entry operators, system managers, technicians and end users
- Data, which is composed or raw, unprocessed facts and figures, that is used as input to be processed into meaningful information as output
- Processes, which are manual and automated ways of achieving a result
- Digital systems which are made up of hardware and software needed to support programming and software use
Digital systems are made up of the following components:
- Networks which exchange data between devices
- Protocols or rules to coordinate and standardise communication between devices
- Application architecture patterns which are a set of principles used to provide a framework for structuring solutions to recurring problems
- Software which comes in three types; systems, applications and utilities
- Hardware or physical equipment for input, output, storage, processing and communication
The physical components of digital systems are known as hardware including items such as monitor mouse, hard disk drive, motherboard, graphics card. Hardware requires software instructions to control it and software requires hardware to carry out its intructions and together form a usable digital system.
- An input device, which are peripherals, that enable users to send data and commands to software and the operating system. They send information to a computer system for processing. An example of this is keyboards, mouses, styluses and scanners. Input devices only allow for input of data to a computer. They can send data to another device but it cannot receive data from another device.
- An output device is something that displays information from a computer in human readable form and examples of these devices include printers and monitors. The purpose of output devices reproduces or displays the results of the processing conducted by the input device. This means that they only receive the output of data from another device. Output devices can only retrieve data from another device and generate data with that data but it cannot send data to another device.
- Processing hardware – the key element of it is the digital processor that converts data into information and controls all other hardware in the system
- CPU (Central Processing Unit) – it handles most of the system’s data manipulation and helped by other processors such as the video card, HDD and audio controller child. Major CPU designers include Intel, AMD, ARM and IBM. Reduced Instruction Set Computing (RISC) CPU’s have smaller instructions sets than Complex Instruction Set Computing (CISC) CPU’s. RISC are cheaper and smaller thus, drawing less power and producing less hear making them ideal in smartphones and tablets
- GPU (Graphis Processor Unit) – a very fast and expensive processor specifically dsigned for high speed image processing in graphics cards. Application software such as Adobe Photoshop exploits GPU power to accelerate processor intensive calculations
- Storage Hardware
- Primary storage - computer’s random access memory (RAM) which has billions of storage locations in silicone chips. RAM stores instructions and values including variables, arrays and other storage structures when programs are running or being created. The RAM chips are volatile because they lose their data when electricity is turned off. Dynamic RAM is used as the main memory in computers and static RAM is used in graphic cards and CPU's.
- Secondary storage - stores data, information and applications when they are not actively used. These devices include Hard disk drives, solid state drives and network attached storage devices. HDD are aluminium disks that are densely crammed with magnetically recorded bits of 1 and 0 which store and retrieve data at incredible speeds with breathtaking accuracy and reliability. SSD store data in the non volatile NAND RAM which means they have no motors to age and fail, they run silently, start up instantly, consume less electricity, generate less heat and can access data faster than a HDD. The NAS is a networked team of HDDs which means they offer more speed and capacity as well as data protection, convenience and reliability.
- A hard disk drive (HDD) is an old-school storage device that uses mechanical platters and a moving read/write head to access data. A solid-state drive (SSD) is a newer, faster type of device that stores data on instantly-accessible memory chips. HDDs are an enclosure contains a series of platters covered by a ferromagnetic coating. The direction of the magnetization represents the individual bits. Data is read and written by a head that moves extremely fast from one area of the disk to another. Since all of these pieces are “mechanical,” the hard disk is the slowest component of any computer – and the most fragile. SSD are newer types of disks that store information on flash memory, which consists of individual memory cells storing bits that are instantly accessible by the controller.
- Communication Hardware – used for sending and receiving data and information from one place to another such as via networks
- Prots – physical sockets or connectors that carry data between a computer and external devices referred to as peripherals. USB (Universal Serial Bus_ is a standardised high speed way to connect many devices including flash drives, printers, modems and keyboards.
- The operating system (OS) will negotiate with the hardware to fulfil the users requests and it knows how to talk to hardware because each device comes with a software driver (similar to a dictionary that tells the OS the commands that the hardware understands). The OS gives a generic command and the driver translates it into the language that is understood by the hardware.
Software is used to control computing devices tp process data and there are many types of software programs used to:
- Calculate such as spreadsheets
- Store and organize data such as databases
- Entertain such as games
- Communicate such as web browsers
- Control devices such as embedded software in TVs
System software tools are used to manage hardware and run the user's programs. In essence they provide the platform for running application or application software by bringing the computers capabilities together. Moreover it also refers to the files and programs that make up your computer's OS including libraries of functions, system services, drivers for devices.
A computing platform is the stage where computer programs run whereas the OS sits between applications and hardware managing how applications access hardware and software resources. Moreover, the platform consists of both the CPU and OS meaning that the OS is part of the computing platform.
Applications such as Microsoft word is used to perform work or complete larger tasks however utilities on the other hand, are usually small single purpose software tools that do a specific job or add functionality to an operating system such as text editors. An application is a computer based program that is designed to perform some tasks that are grouped together and helps users in competing their work at faster speeds by using and showing a group of functions that are coordinated together. It can manipulate data such as texts and graphics. In comparison to this utilities may often come with the OS and it is a program that is designed to perform specific tasks that help in making the device work better and keeping the environment safe.
The Operating system such as Windows, Linux, iOS or Android, control a computer;s hardware and runs the user;s application software. They perform similar functions such as:
- Loading and aving data and programs
- Displaying output and printing
- Processing sound and music
- Allocating memory for user programs
- Watching the users keyboard and mouse activity
- Ctrolling network and intert access
- Encrypting, decrypting, compressing and decompressing data
- Caching downloads
- Controlling user logins and maintaining security over accounts, files and access to resources
- Running background programs such as disk defragmenters and virus scanners and checking for upgrades to keep the system working efficiently
A programming language is a formal language, which comprises a set of instructions that produce various kinds of output. Programming languages are used in computer programming to implement algorithms. Most programming languages consist of instructions for computers. Programming means designing a set of instructions to instruct the computer to carry out certain jobs that are very much faster than human beings can do. The earliest programming language is called machine language which uses the binary code(comprises 0 and 1) to communicate with the computer. However, the machine language is extremely difficult to learn . Fortunately , scientists have invented some high-level programming languages that are much easier to master. Among the high-level programming languages are Java, Javascript, C, C++, c# and Visual Basic.
Programming languages differ in the amount of direct control they give over a computer's hardware and OS. A high level programming language means that the users avoid having to worry about the complex details of the structure of actual disk files or where the data is stored in memory. They are simpler to use but lack the control of complex and more difficult to learn low level programming languages. Conversely, these low level languages requires much more skill and knowledge but allows for more direct control of the workings of the computer. Low level and high level programming languages have different purposes and uses which make them better for certain things.
There are several essentials tools that are needed to develop software such as an editor, compiler, interpreter and debugger.
- An editor is a specialised application that is used for creating huamn readable source code or programming instructions. Code editors come with special features that are designed to make programming easier for the user such as by highlighting programming key words and using code completion to identify any typos or other mistakes.
- A compiler converts source code into executable programs that a computer can carry out which means that the CPU and the OS is able to understand it. An interpreter directly executes source code without needing to compile it beforehand. Executable code compiled for one platform (combination of a CPU and OS) will generally not work on another without being ported (re-complied).
- A debugger helps programmers to find any bugs or programming errors and can take a long time. Debuggers assist this process by highlighting incorrect syntax (programming expression) and show how they should be expressed, allowing programmers to set break points in code where the compiler will stop and let the programmer inspect the current values of variables or by allowing line by line stepping through code so developers can find exactly where a problem arises and fix it.
An IDE is an Integrated Development Environment which combines the development tools into one package which makes it easier for the developers and programmers to be able to create source code that does what they need it to do. The IDE consists of the:
- Toolbox of GUI -objects the programmer can insert into the program
- Code window - programmer uses this to instruct the program how to act when an event takes place
- Form - the visible interface (within software the place where people control the program, enter data and receive output)
- Properties of the selected object - lets the programmer modify an objects characteristics or behaviour
- Project manager - lets the programmer manage various files and components related to the program
- Onscreen help to give brief reminders of what the currently selected object is like
A storage structure is a location in RAM where data is stored during the execution of a program. The two main data storage structures are variable and constants. The key difference between a variable and a constant is that the value stored in a variable can or may change during the running of the program however, the constant value cannot be changed in the running of the program. However, both constants and variables can only hold one piece of data at a time.Arrays can store many values in numbered slots and to refer to an individual value you simply have to give the name of the array and the desired index, slot number.
- Characteristics of data types
In programming, classifying a variable by data type is a way of determining the data that variable can contain as well as how that variable can be manipulated (what it can do and what can be done to it).
Data types | Explanation |
Numeric | Consists of whole numbers, referred to as integers and decimal numbers (floating point numbers). Integers can be unsigned (positive) or signed (positive and negative). All numerica data types can have mathematical operations peformed on them and follow BODMAS. |
Integer | Commonly represented internallty in a computer as a group of binary digits called bits (smallest unit of data with a binary value of 0 or 1). Going beyond the maximum and minimum values of integers can cause an integer overflow – resulting in a program crashing or producing invalid output. |
Floating Point | A mantissa which contains the digits of the number that is represented, either positive or negative. An exponent which helps to determine where the decimal point is placed. |
Character | The character data type is a symbol that has meaning – a letter, number, punctuation mark, symbol or even a space. Meaningful depends on character encording which is one way a computer program can translate binary data into meaningful characters. A set or sequence of characters is referred to as a string. |
Boolean | Only have two possible values: 0 or 1. Often referenced with the words ‘true’ or ‘false’ in a programming language. They can be treated mathematically allowing for comparison operators . |
- Characteristics of data structures
A Data structure is a method of organising data to allow particular operations to be performed on them efficiently.
Data structure | Explanation |
Array | Contains groupings of data and these elements are all of the same data type. It can also store groupings of other data structures such as fileds or records. Very useful in programming as they allow for related sets of data to be organised and ordered efficiently The contents of arrays are referenced using an index value and the way they are stored means that each element has a set position within it. |
Associative Array. | A special type of array data structure consisting of a collection of key and value pairs where the key is unique and can be of any data type or structure. A limitation is that the key values are not organised or sorted in a consistent way. |
Dictionary | A synonym for an associative array. |
Hash Table | A particular type of associative array where it uses pairs where instead of the value it is a one dimensional array. It is computed using a has function on the value to be inserted. One benefit is that it allows for efficient searching because they move elements into smaller array ‘buckets’ meaning there are fewer items to look through. The perfect hash function results in a hash table which only has one element in each bucket. |
Queue | A data structure that can contain any other data type of structure including other queues. The elements of data in a queue are inserted at the end of the queue (enqueuer) and each element can only be accessed by taking it from the start of the queue (dequeuer) – referred to as FIFO access. Useful for implementing functionality to manage wait lists or access to share resources. |
Stack | A data structure where elements of data in a stack are inserted at the top of the stack (pushed) and each element can only be accessed by taking it from the top (popped). Referred to as FIO access. It can contain any data type or structure and useful for implementing functionality. |
Linked List | An ordered set of elements in qhich each element is connected to the next element on the list and allows data elements to be ordered into a sequence and allows for efficient insertion and removal of elements from any position in the sequence. Each element is referred to as a node and each node contains a data element as well as the memory adrees of the next node in the linked list – referred to as a pointer. It is easy to add and remove elements at the start, middle and end of the list. |
Record and Field | A record is a basic data structure for collections of related elements where the elements may or may not be the same data type. A record consists of a number of fields which are typically fixed and do not tend to change when the record is defined and used. Each field has a name and each has its own data type. Records are most useful when variable in a collection are related to each other as it provides a logical method of ordering data. |
Class | A class is a programmer defined data structure that exists in object orientated programming. They group together conceptually similar functions and variables into one place and work as templates for creating objects. They describe all fo the elements and components that are required tby the object created from the instance of the class. The purpose of a class is to create a template for objects with predetermined properties and behaviour and can contain relevant variables, data types, data structures, methods and events. |
- Design tools representing the functionality and appearance of solution designs such as data dictionaries, mock-ups and pseudocode
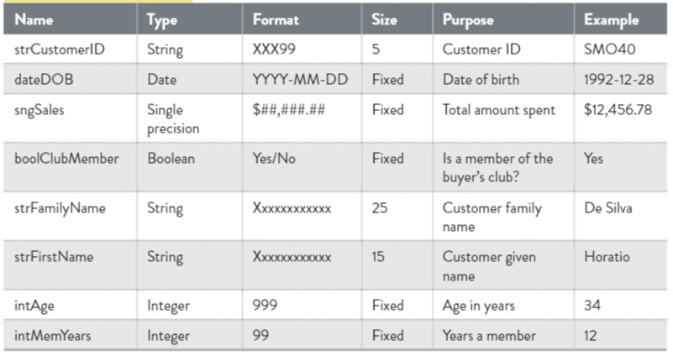
Data dictionary – used to plan the storage of software elements including variables, data structures and objects such as GUI textboxes or radio buttons. A data dictionary should list every variables name, data type or structure and may include the data’s purpose, size, description, formatting and validation. They are incredibly valuable when code needs to be modified later by other programmers and the purpose of a variable is unclear
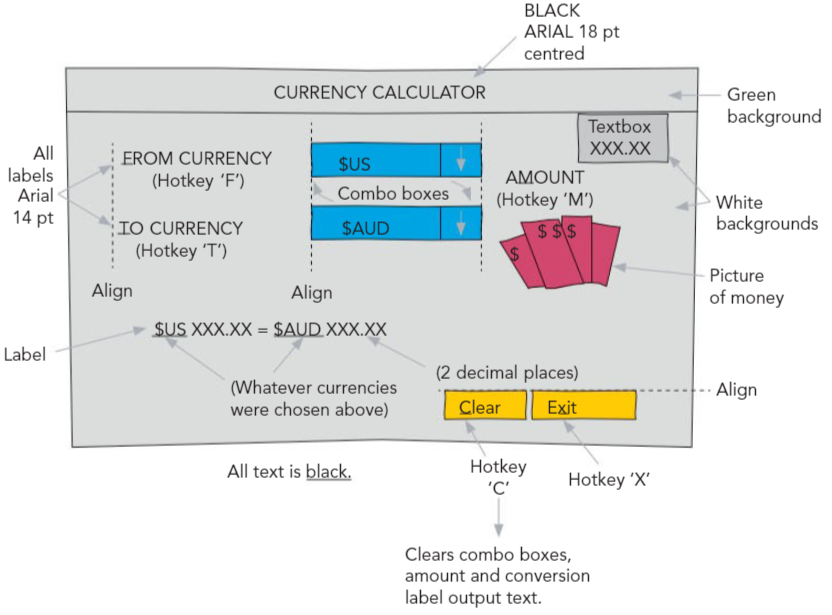
Mock ups – used to design an interface and it is a sketch showing how a screen or printout will look like. They are considered successful if it can be given to another person and they can create the interface without asking any questions. It will usually include the following features:
- The positions and sizes of controls such as buttons and scroll bars
- The positions, sizes, colours and style of text such as headings and labels
- Menus, status bars and scroll bars
- Borders, frames, lines, shapes, images, decoration and colour schemes
- Vertical and horizontal object alignments
- The contents of headers and footers
Pseudocode – is a quick, flexible, language independent way of describing a calculation strategy – it is halfway between source code and English. Once the algorithm is described in pseudocode it can be converted into source code for any desired programming language. A clever strategy can make software run twice as quickly or use half the amount of RAM. In pseudocode, make sure that it is specifies the assignment (storage of a value) using the arrow symbol rather than the equals sign (that is reserved for logical comparisons). Common features found in pseudocode include:
- Iteration or loops
- Conditional control structures
- Logical operators
- Arrays
- Associative arrays
- Records and fields
- Arithmetic operations
- Naming conventions for solution elements such as files, functions, methods and variables
A naming convention is a set of rules that is used when creating variables, subroutines, functions, methods, objects classes and so in as well as in programming source code and internal documentation. The most useful naming conventions allow a programmer to know the purpose of an element, and if relevant its data type or structure.
Camel Case – uses compound words and phrases as a naming convention where each words after the first begins with a capital letter. No spaces or punctuation are included when naming variables and other elements. While multiword variable and function names are useful it is important that they are as short as possible.
Snake Case – joins each word in the phrase using an underscore and all words are in lower case. It is easier to read the variable and function names due to the underscore separating each word.
Hungarian Notation – it compounds words and phrases without spaces and each word after the first begins with a capital letter. However, it adds a prefix that is an initial letter sequence representing the data type or structure of the variable. This can be useful when programming using programming languages that are not dynamically types as it immediately tells a programmer what data type or structure they are handling when reading the name.
File naming conventions are also important and it is most important to use a consistent naming convention for all files and folders related to a project. This includes logically named folders, subfolders, files and backups of files – this will allow to stay organized and easy to identify files when looking for them. The following elements should be taken into account when naming files:
- Include the right amount of information in the name of file – shorter the better but enough to provide the purpose and use of the file
- Use meaningful abbreviations when reducing the number of characters
- Filenames should contain as little punctuation as possible for portability reasons as some OS systems do not like punctuation in their file names
- Begin your filenames with more general components such as a date marker then include a more specific reference to the file
- The dates on the file should be in yyyy-mm-dd format to allow chronological ordering
- Separate your source code from design documentation
- Use subfolders where relevant
- If appropriate include version numbers
- Useful to document the file naming conventions you have chosen to use for files and folders – especially if abbreviation and acronyms are used
- Ensure file naming conventions are followed consistently
- Project plans to coordinate and monitor the tasks, including sequencing and time allocation to create software solutions
Project planning is an essential step in guiding stakeholders, sponsors, teams and the project manager through the other project phases. It is required to identify the required goals, reduce risks, avoid missed deadlines and to ultimately provide the agreed product, service or result. Without careful project planning it is highly likely that project performance will suffer. It is used to coordinate and monitor tasks, including their sequencing and the amount of time required to complete each task which can involve tracking the milestones that exist within a project timeline.
A Gnatt Chart is a graphic timeline that:
- Lists all the tasks in a project
- Organises the tasks in order
- Shows which tasks must wait for the other tasks to finish before they can begin
- Allocates people and resources to tasks
- Tracks the progress of tasks and of the entire project
It can be created using software tools such as Microsoft Excel or specialised project planning tools such as Microsoft Porject.
A task is any activity within the project timeline that needs to be completed within a defined period of time and an essential component of the project as a whole and typically requires management of resources such as people, software and hardware. All tasks that are required to be completed should be shown in the project plan. The names given to tasks should concisely describe the task with enough detail to be understood and can contain sub tasks – they may be required if the core task consists of more than one smaller tasks. This allows for more flexibility in the allocation of time for tasks.
Task dependencies is when a task depends on one or more other tasks having been completed in order to begin and those tasks are referred to as predecessors and dependent tasks are called successors. Any delay in a task that is a predecessor can have an effect on subsequent tasks which can cause deadlines to not be met. If a task runs over time, the length of time that can elapse before it affects other tasks is called slack time.
A milestone represents the achievement of a significant stage in a prokect and itself has zero time duration. In a Gnatt chart, Milestones are displayed using a diamond shape.
- Analyze solution requirements to develop a software solution
The scope outlines the boundaries or parameters of the solution so all stakeholders are aware of exactly what the solution will contain. It consists of two elements – what the solution will do and what the solution will not do.
What the solution will do is set out in a list of all the solution requires both functional and non functional.
What the solution will not do is set out in a list of all the solution requires that will not be included. It could be solution requirements of the client have because of constraints have been left out. By identifying what the solution will not do will prevent arguments later on in the project between the developer and the client. This can then avoid legal problems as well.
A scope creep refers to how a projects requirements tend to increase over a projects lifecycle and is usually caused by stakeholders changing the requirements or sometimes from internal misunderstandings and miscommunication.
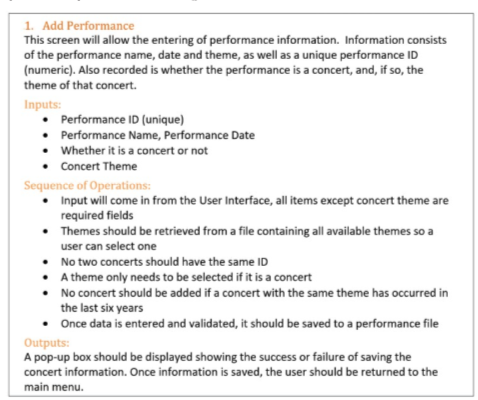
Functional requirements are directly related to what the solution will do for will achieve as a part of the solution. They typically involve: calculations, data processing, opening, reading and writing files, data manipulation and other specific functionality. Some examples of functional requires for software solutions is that they:
- Save customer data to a file
- Calculate discount values on products
- Set an alarm to go off at a particular time
They are usually described in terms of the inputs required, the sequence of operations that will be performed within the function and the output of the function after the processing has occurred.
On the other hand, the non functional requirements are other requirements that the user or client would like to have but do not affect what the solution does and often related to appearance and user experience. They can be categorised in terms of usability, reliability, portability, robustness and maintainability. These requirements must be measurable meaning it must be possible to test them to see if the requirement is met.
- Usability – relates to how easy a system is to learn and use and typically described in terms of efficiency and effectiveness. Common factors of usability include the clarity of the user interface and intuitiveness of the functions within the system, It is measures in terms of the user satisfaction.
- Reliability – relates to how much it can be depended upon to function as designed and for how long. Typically this requires that the software is deemed fit for purpose over time and that it is resistant to failure, Generally expressed a probability measure where it is 1 – the probability of failure.
- Portability 0 relates to how easily it can be used in different operating environments. This can involve measuring how easy it is to move from one system to another with the same architecture – how easy it is to reinstall a program on a new system and ability to use the same software on multiple operating systems and platforms. The most time consuming element of portability is the requirement to write software that will work on multiple operating systems and platforms – the developer must separate the user interface from the core functionality and logic.
- Robustness – relates to how well a software solution responds to errors that occur when the software is being used and it should peform correctly in every situation a user encounters. It is an evaluation of the error handling techniques built within a software solution. Closely linked to the validation techniques that can help to prevent these errors from occurring and is measured in terms of numbers of failures, crashes and errors that occur while running.
- Maintainability – related to how easy it is to look after the software once it is n use and can include fixing errors in the code, maximising efficiency and reliability, installing the software on new systems and expanding on current functionality. It is measured in terms of how easy it is to fix, modify or chance the software once people are using it.