

Big Idea 2: Data
Binary Numbers
Any digital data has a numerical representation using binary numbers.
A bit is the smallest unit of information stored or manipulated on a computer; it consists of either zero or one.
Base Conversion
Binary to Decimal Conversion
Of course, binary numbers are rarely used in real life.
Therefore, programmers must be able to go back and forth between the binary numbers we use in computing and the decimal numbers that we use in everyday life.
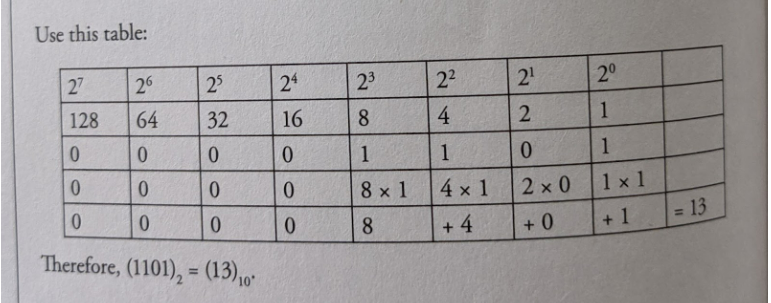
The key is to remember that the different binary digits represent different powers of 2.
For example, let's use the binary number 1101.
Decimal to Binary Conversion
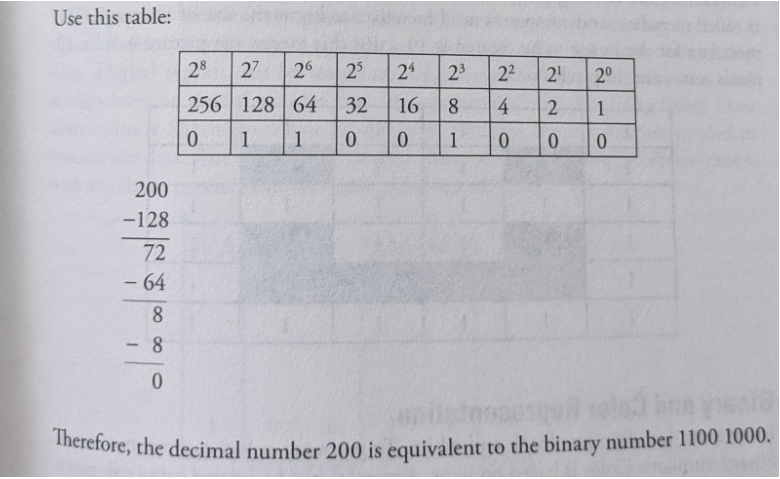
We need to find the powers of 2 that add up to the given decimal number. Start by finding the largest power of 2 that is less than the number.
Subtract that number from the original, and repeat until you're down to 0.
Try the example of the decimal number 200.
Digital Images as Bits
Images displayed on the screen are converted into binary formats and then processed by a computer displayed on our screen.
Digital images: are a collection of pixels. where each pixel consists of binary numbers.
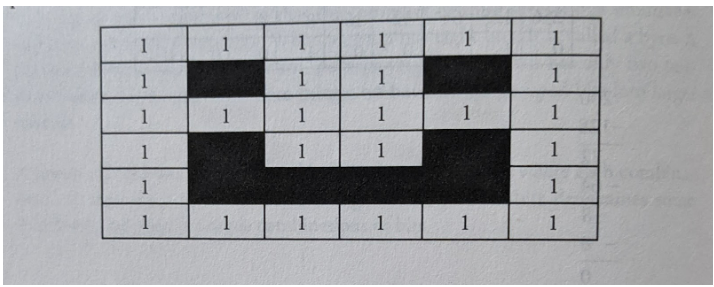
If we say that one is black (or on) and o is white (or off), then a simple black and white picture can be created using binary Draw a grid and color the squares (1-black and 0-white) to create the picture
However, before creating the grid, the site of the grid needs to be known.
This data is called metadata, and computers need metadata to know the size of an image.
The metadata for the image to be created is 10 x 10; this means the picture will be 10 pixels across and 10 pixels down.
Binary and Color Representation
Images: are not often just black and white.
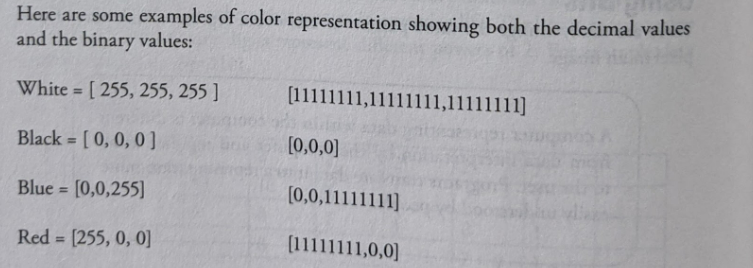
To represent colors computers also use binary numbers.
Color: is based on light.
Any color can be created using red, green and blue light.
The maximum value for any color in decimal 255, which is repte sented by 11111111 in binary.
The minimum number is 0.
Music as Bits
An analog signal exists throughout a continuous interval of time and takes on a continuous range of values.
A digital signal is a sequence of discrete symbols.
If these symbols are zeros and ones, we call them hits.
As such, a digital signal is neither continuous in time nor continuous in its range of values.
Sampling: is recording an analog signal at regular discrete moments and converting them to a digital signal.
Digital signals are resilient against noise.
Data Compression
Data compression: is used everywhere.
Mp3, mp4, rar, zip, jpg, and png files (along with many others) all use compressed data.
Compression: is also an important consideration when it comes to backing up and archiving your important files, particularly for uploading over the Internet.
Compression is a two- way process: a compression algorithm can be used to make a data package smaller, but it can also run the other way, to decompress the package into its original form.
Data compression: is useful in computing to save disk space, or to reduce the bandwidth used when sending data (eg, over the Internet).
Data compression deals with taking a string of bytes and compressing it down to a smaller set of bytes, whereby it takes either less bandwidth to transmit the string or to store it to disk.
Lossless algorithms: are those that can reconstruct the original message exactly from the compresed message, and lossy algorithms can only reconstruct an appsimation of the original message.
Lossless algorithms are typically used for text, and lowy algorithms for images and sound where a little bit of loss in resolution is often undetectable, or at least acceptable.
Lossless compression: packs data in such a way that the compressed package can be decompressed, and the data can be pulled out exactly the same as it went in.
Text compression: is another important area for lossless compression.
It is very important that the reconstruction is identical to the original text, as very small differences can result in statements with very different meanings.
Lossy compression is a technique that does not decompress digital data back to 100% of the original.
Lossy methods can provide high degrees of compression and result in smaller compressed files, but some number of the original pixels, sound waves, or video frames are removed forever.
Lossy is used in an abstract sense, however, and does not mean random lost pixels, but instead means loss of a quantity such as a frequency component, or perhaps loss of noise.
Images: high image compression loss can be observed in photos when enlarged
Music: there is a difference between an MP3 music and a high-resolution audio file
Video: moving frames of video can handle a greater loss of pixels compared to an image
Using Programs with Data
The increase in digitization of information, mixed with multiple transactions, has resulted in a flood of data.
The advancement in technology has promoted the rapid growth of data volume in recent years.
By analyzing large data sets of data, it is possible to categorize connections from unconnected data sources and find specific patterns.
Data extraction: is the process of obtaining data from a database or software such as a social media website so that it can transport it to another software (such as spreadsheets) designed to support online analytical processing.
Data extraction is the first step.
The next step is to transform (either through filters or programs).
The final step is to analyze using graphs and other data visualization tools.
Below are the steps to extract data and analyze them:
Analyze the data sources.
Data sources are found in different forms like web pages, emails, and chat video files, audio files, text documents, customer messages.
Know what will be done with the results of the analysis.
It is vital to understand what sort of outcome is required.
Is it a trend, effect, cause, quantity, or something else that is needed?
Decide the tools needed to read the data, and the repositories such as databases needed to store the data.
Clean the data of whitespace, symbols, duplicates, etc.
Understand the data patterns and text flow. This should be done using visualization tools.
How to read and analyze graphs
A graph is a pictorial representation, a diagram used to represent data.
It usually is used to depict a relationship.
Graphs and charts: represent data in points, lines, bars, pie charts, and scatter plots.
Different types of graphs and charts display data in different ways.
Some are better suited than others for different uses.
Picture graphs: use pictures to represent values.
Bar graphs: use either vertical or horizontal bars to represent the values.
Line graphs: use lines to represent the values.
Scatter plots: represent the data with points, and then a best-fit line is drawn through some of the points.