Aggregate Demand-Aggregate Supply Model
Real GDP represents aggregate output where all else equal a change in real GDP is accompanied by a change in employment.
REAL GDP= AGGREGATE SPENDING (Expenditure approach)= AGGREGATE INCOME**(Income approach)**
Y= income
Aggregate Price Level is a measure of inflation
Aggregate Demand
the demand for all goods and services purchased in product markets.
Aggregate spending= C+I+G+XN
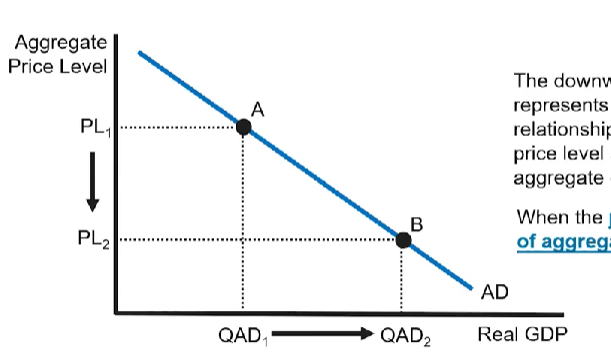
Price Level and Aggregate Demand
THERE IS AN INVERSE RELATIONSHIP BETWEEN QUANTITY OF AGGREGATE OUTPUT DEMANDED AND PRICE LEVEL → IF PRICE LEVEL INCREASES, THEN QAD DECREASES
A decrease in the price level causes a movement down and to the right along a given aggregate demand curve because there will be more quantity aggregate output demanded.
Why is AD downsloping?
Real wealth effect, interest rate effect, and exchange rate effect.
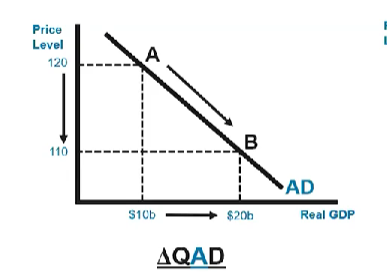
Change in Quantity Aggregate Output Demanded (QAD)
A change in quantity aggregate output demanded: a change in the QAD is a movement along a given aggregate demand curve and is ONLY caused by a change in the price level
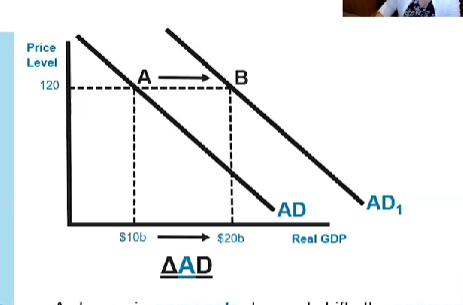
A change in aggregate demand (AD)
A change in aggregate demand: a change in aggregate demand shifts the aggregate demand curve and is caused by a change in a non-price level determinant of aggregate demand.
A change in aggregate demand is a change in the quantity of aggregate output demanded at EVERY PRICE LEVEL.
Real Wealth Effect (Real balances effect)
A change in the price level causes the purchasing power of a given amount of wealth to change.
When PL🠹 the purchasing power of a given amount of wealth🠻, it leads to a decrease in the quantity of aggregate output demanded.
When PL🠹 PP🠻 QAD🠻
When PL🠻 the purchasing power of a given amount of wealth🠹, it leads to an increase in the quantity of aggregate output demanded.
When PL🠻 PP🠹 QAD🠹
Interest Rate Effect
A change in the price level causes a change in the demand for money, which leads to a change in the interest rate, which causes a change in the cost of goods and services purchased with borrowed money.
When PL🠹, people need more money to purchase a given amount of goods and services
An increase in money demand leads to an increase in the interest rate which leads to an increase in the cost of goods and services paid for with borrowed money.
→ Leads to a decrease in the quantity of aggregate output demanded.
WHEN PL🠹 QAD
Exchange Rate Effect
A change in the price level in country X makes Country X’s goods and services relatively more or relatively less expensive to foreign purchasers, which causes a change in the quantity demanded of country X’s exports.
When PL🠹 domestic goods and services become relatively more expensive to foreign purchasers, which leads to a decrease in the quantity of aggregate output demanded (QAD🠻)
When PL🠻 domestic goods and services become relatively less expensive to foreign purchasers, which leads to an increase in the quantity of aggregate output demanded (QAD🠹).
Determinants of AD (Shifters)
Consumer spending, gross private domestic investment spending, government spending, and net exports.
ANY CHANGE TO C, I, G, XN SHIFT THE AD CURVE.
INCREASE → SHIFT TO THE RIGHT
An increase in C,I,G, OR EXPORTS or a decrease in imports.
DECREASE → SHIFT TO THE LEFT
A decrease in C,I,G, OR EXPORTS or an increase in imports
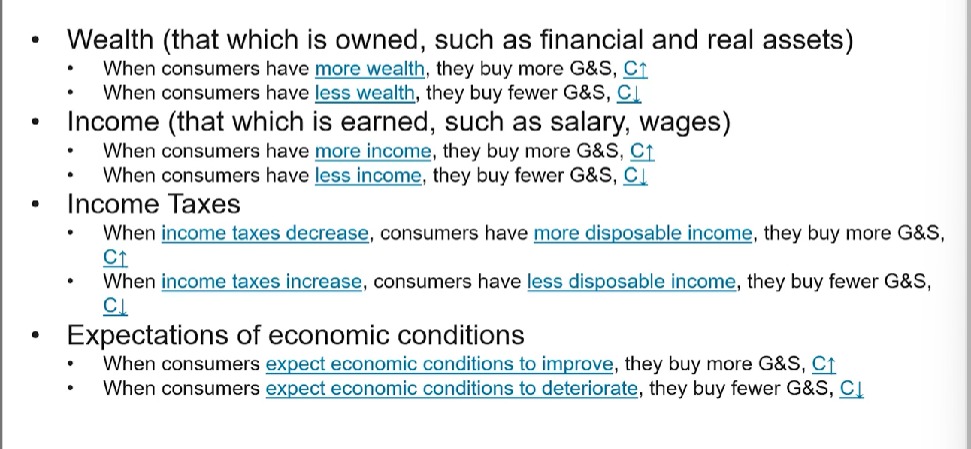
Determinants of consumption
Wealth, income, income taxes, expectations of economic conditions.
Interest-sensitive components of consumption
Include purchases of automobiles, student loans, and durable goods.
When interest rates fall, C🠹
When interest rates rise, C🠻
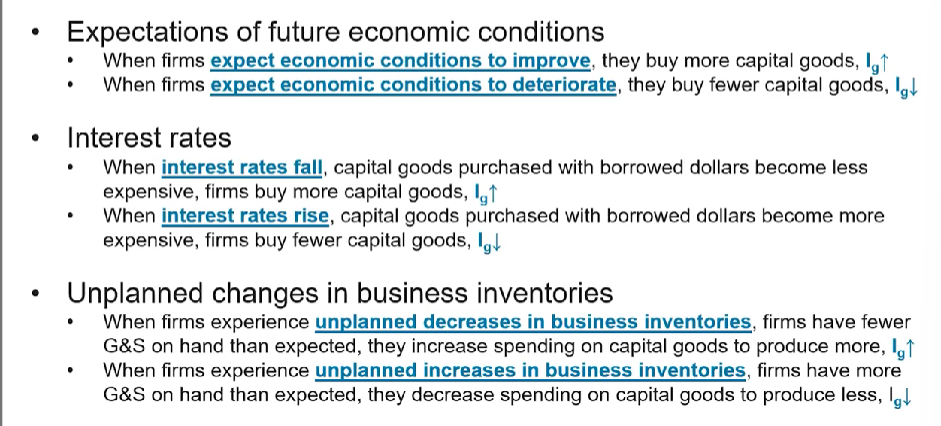
Determinants of Investment Spending
expectations of future economic conditions, interest rates, and unplanned changes in business inventories.
Determinants of Net Exports
Relative prices
Exchange rates
Relative incomes
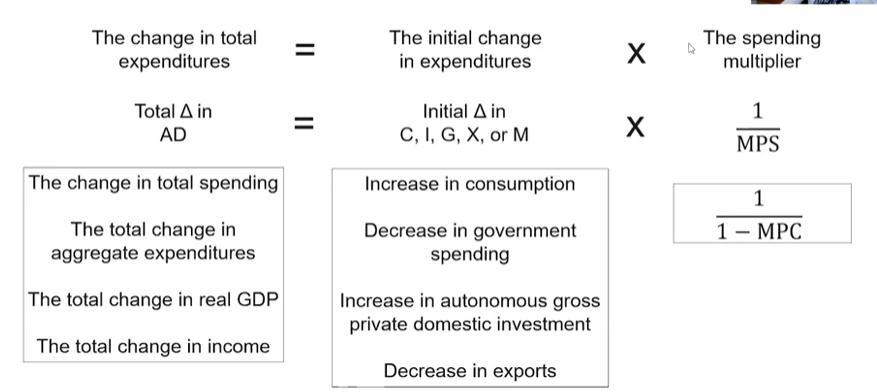
Autonomous expenditure
Households, firms, and governments must spend money on certain things regardless of their income to meet their basic needs. (Independent of income)
If this increases, then Aggregate Demand (output) will increase by more.
Marginal Propensity to Consume (MPC)
the percentage of an additional $1 earned in disposable income that is spent on consumption.
Disposable income (Yd)
Gross income - income tax
How to dispose of it? By consuming or saving.
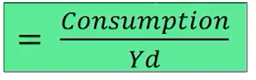
Average Propensity to Consume (APC)
the percentage of disposable income that people spend to consume.
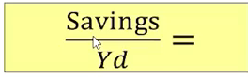
Average Propensity to Save (APS)
the percentage of disposable income that people use to save.
Marginal Propensity to Save (MPS)
the percentage of an additional $1 earned in disposable income that is used to save.
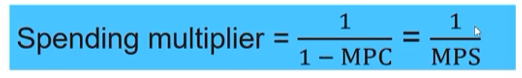
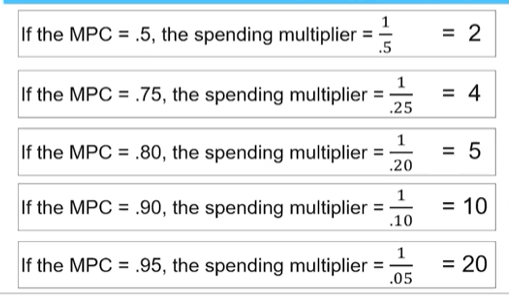
Spending/Expenditure Multiplier
quantifies the total change in AD that results from an initial change in autonomous spending.
MPC + MPS =
1
General Spending Multiplier Scenarios
How the spending multiplier, AD, and MPS/MPC may show up
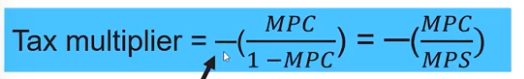
Tax multiplier
Quantifies the total change in AD that results from an initial change in taxes or transfer payments.
Transfer Multiplier
Relationships between taxes and transfers and changes in AD
There is an inverse relationship between a change in taxes and the change in AD (e.g When taxes increase, AD decreases)
There is a direct relationship between a change in transfers and a change in AD.
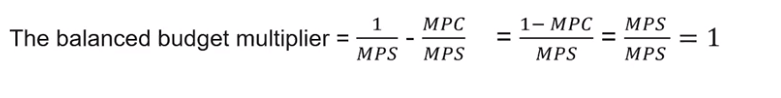
The balanced budget multiplier
Short-run
refers to the time period in which at least one input price is fixed.
Input costs or prices
refers to what firms pay for the purchase of factors of production such as land, labor, and capital.
Thus, they tend to “fix” these input costs through contracts with employees, leases for retail price, and agreements for commodity prices.
Sticky input prices
refer to the fact that fixed input prices do not respond to changes in the price level immediately.
Aggregate Supply
the quantity of aggregate output supplied in an economy.
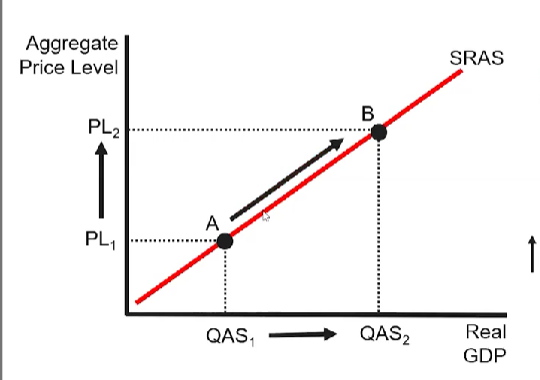
Short-run Aggregate Supply Curve
describes the relationship between the price level and the quantity of aggregate output supplied in the short-run (or the time in which input prices must catch up to the price level).
Why is SRAS upward sloping?
Because of sticky input prices.
When PL rises, what happens to quantity of aggregate output supplied?
the quantity of aggregate output supplied rises.
This is because as price level increases the relative level of profit increases as well because sticky input costs have not caught up.
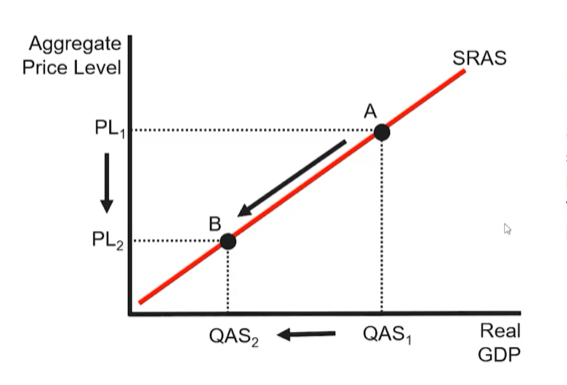
When PL falls, what happens to aggregate output supplied?
the quantity of aggregate output supplied falls.
Since wages are “sticky” in the short-run, a decrease in the price level results in lower profits for firms, which incentivizes them to produce less.
Relationship between PL and QAS
As PL🠹 → 🠹QAS (there is more production, firms need more workers!) → U.R🠻
As PL🠻 → 🠻QAS (there is less production, firms need less workers) → U.R 🠹
Determinants of SRAS (Shifters)
Anything that makes it CHEAPER or EASIER to produce goods and services will increase SRAS, which is depicted by a rightward shift of the SRAS curve.
Decrease in input costs
Wages and commodity prices (energy)
Increases in productivity
Technology
Government policy
Deregulation
Subsidies
Corporate taxes
Anything that makes it HARDER or MORE EXPENSIVE to produce goods and services will decrease SRAS, which is depicted by a leftward shift of SRAS.
Increases in input costs
Destruction of resources (natural disaster)
Government policy
Increased regulation
Increase on business taxes, taxes on production
Inflationary expectations and SRAS
If firms expect the price level to fall, they will increase production in the short run, and SRAS curve shifts right.
If firms expect the price level to rise, they will decrease production in the short run, and SRAS curve shifts left.
Characteristics of the Long-Run
Period of time when all input prices are variable.
Characterized by fully-flexible wages and prices.
Producers have no incentive to change the level of output because input prices change in response to changes in the price level.
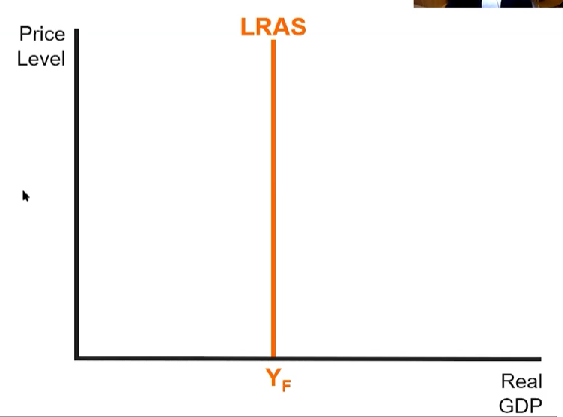
Long-Run Aggregate Supply (Potential output)
the maximum productive capacity of the economy is the quantity of aggregate output supplied when the economy is at full-employment.
Shifters of LRAS
Changes in the natural rate of unemployment.
Independent of the price level
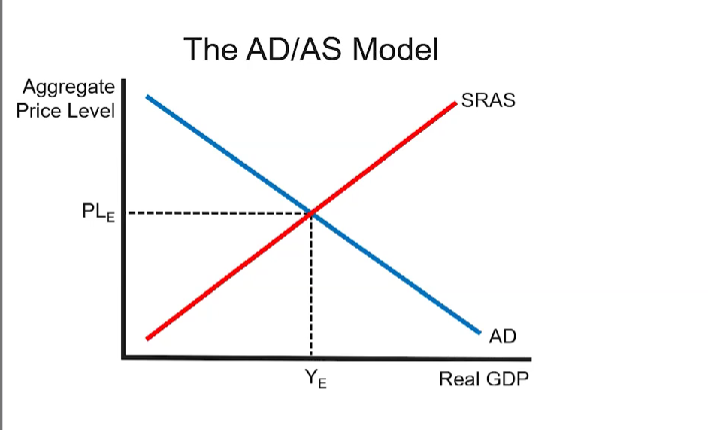
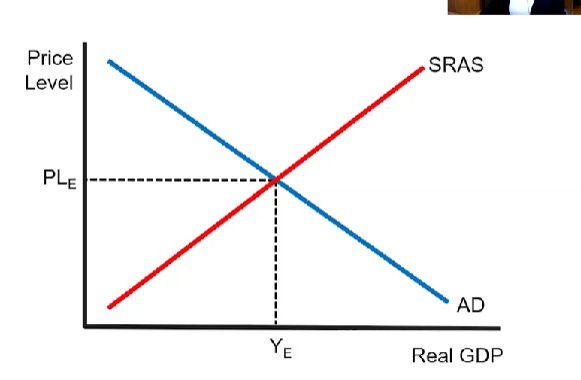
Short-run equilibrium
Between AD and SRAS
Equilibrium points: Where QAS AND QAD meet at a price level.
Surplus in short-run disequilibrium
If the PL is higher than the equilibrium PL → Surplus (QSRAS>QAD)
How to eliminate: producers must lower their prices until QSRAS=QAD
Shortage in short-run disequilibrium
If the PL is lower than the equilibrium PL → Shortage (QAD>QSRAS)
How to eliminate: producers must rise their prices until QSRAS=QAD
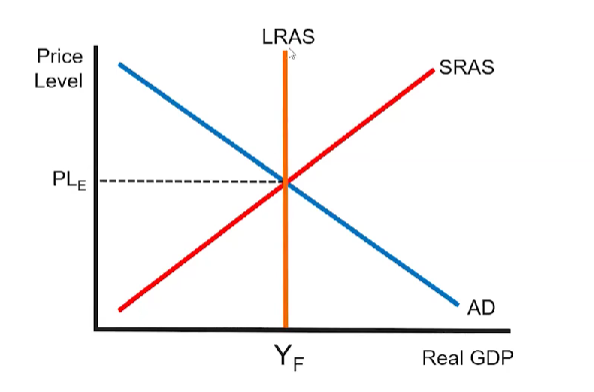
Long-run equilibrium
when the economy is in long-run equilibrium, current output is equal to potential output
Actual rate of unemployment = natural rate of unemployment.
POTENTIAL OUTPUT: Yf
ACTUAL OUTPUT: Y1 or YC
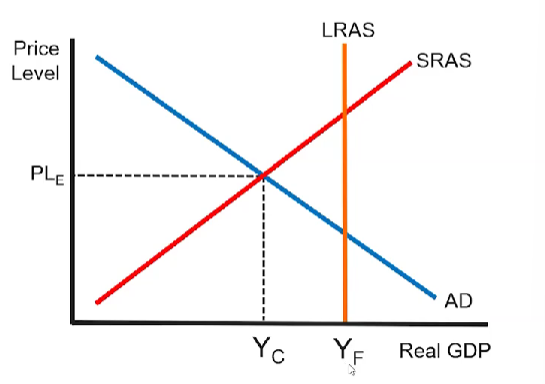
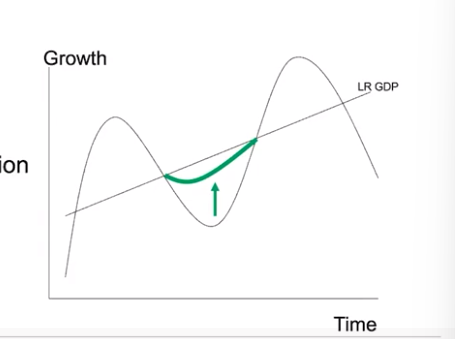
Recessionary gap
when the current output is less than the potential output.
Actual rate of unemployment > natural rate of unemployment.
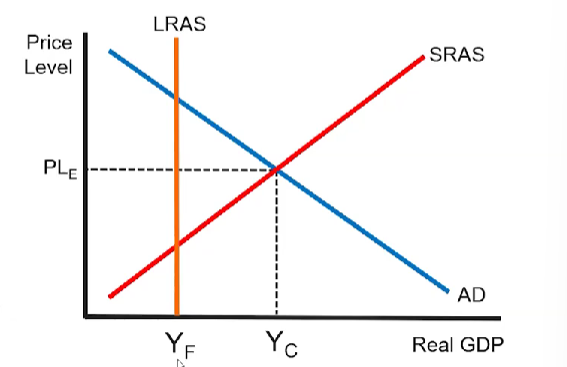
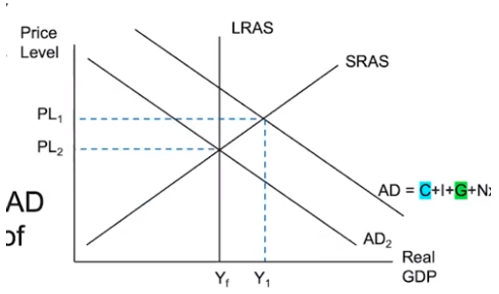
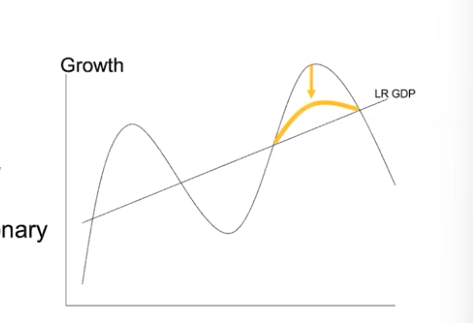
Inflationary gap
when the current output is more than the potential output.
Actual rate of unemployment < natural rate of unemployment
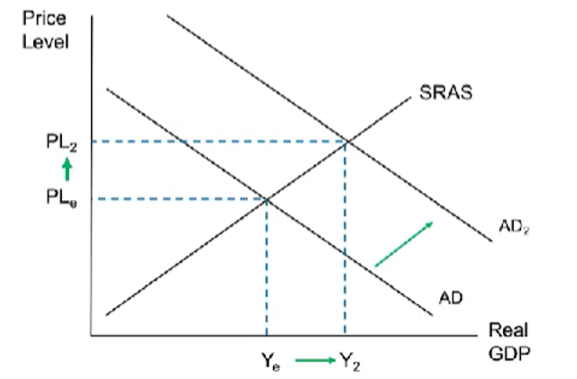
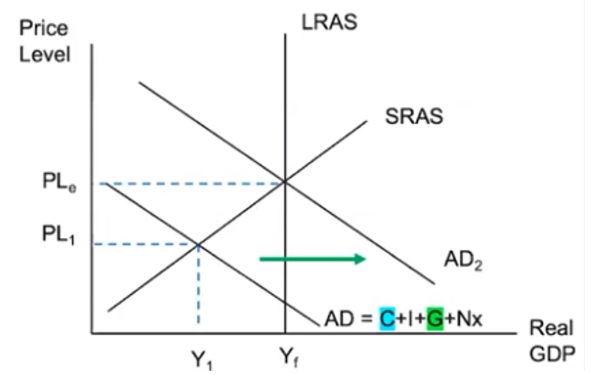
Positive Aggregate Demand Shocks:
Will shift the AD curve to the right.
Increase in the price level and an increase in the output.
Unemployment decreases
Shifts to the right
CAUSES C, I, G, XN TO INCREASE
Negative Aggregate Demand Shocks
CAUSES C,I,G, XN TO DECREASE
Price level falls and output falls
Unemployment rises.
Shifts to to the left
Positive short-run aggregate supply
INCREASE IN THE SRAS
SHIFT TO THE RIGHT
Price level falls and output increases
Unemployment falls.
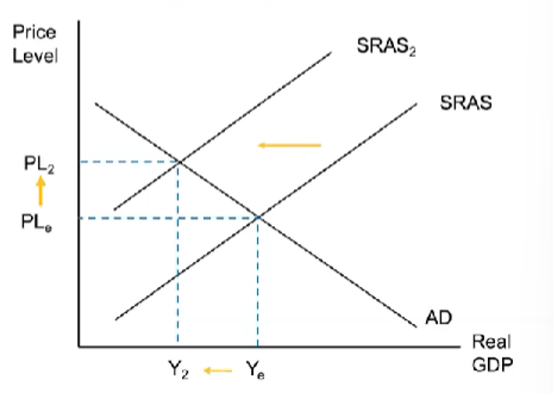
Negative short-run aggregate supply
DECREASE IN THE SRAS
SHIFT TO THE LEFT
Price level rises and output falls
Unemployment rises
Demand-pull inflation
Inflation that comes as a result to an increase in AD.
Cost-push inflation (Stagflation)
Inflation that comes as a result to a decrease in SRAS.
Prices are increasing, but output is decreasing.
Long-Run Self-Adjustment (SRAS)
No policy action taken by the government.
The expectation is that businesses and workers will adjust their price and wage expectations to bring the economy back into equilibrium.
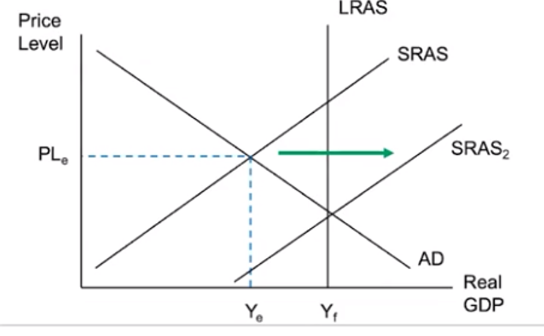
Long-Run Self-Adjustment in Recessionary gaps
SRAS will shift to the right (increase)
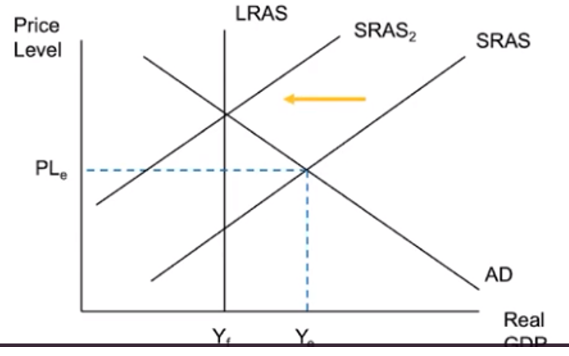
Long-Run Self-Adjustment in Inflationary gaps
Why does the economy self-adjust in a Recessionary gap?
Higher unemployment → over-time workers will adjust their wage expectations to be lower because they want to work.
Businesses aren’t selling → they will adjust their price expectations to be lower and lower their prices.
Shifts the SRAS to the right as it increases, resulting in a decrease in inflation and a decrease in unemployment.
Why does the economy self-adjust in an Inflationary gap?
When in an inflationary gap, an economy is “overheating” and running beyond capacity.
How will businesses and workers adjust?
Workers expect their wages to increase because their labor is more in demand.
Businesses WILL pay their workers more, which will be an input cost for them.
Businesses expect their prices to increase because their supply is in more demand.
Shifts the SRAS to the left, resulting in an increase in inflation and an increase in unemployment.
Fiscal policy (AD)
implemented by governments to intervene when the economy overheats or underperforms in an attempt to bring the economy into full employment.
Affects:
Government spending
Taxes
Expansionary Fiscal Policy
Used when the economy is in a recessionary gap
Government spending: increases!
Has a direct impact on AD
Has the greater impact overall because it impacts government spending, which is part of AD (C+I+G+NX)
Taxes: cut or decreased!
This has an indirect impact on AD
Has a smaller impact overall because they only impact consumer behavior.
Contractionary Fiscal Policy
Used when the economy is in an inflationary gap.
Government Spending: decreases!
This has a direct impact on AD
This has the larger impact.
Taxes: increased!
This has an indirect impact on AD.
Has the smaller impact.
Automatic stabilizers
policies that are already in place in an economy due to previously passed legislation.
Income taxes
Transfer payments
Automatic stabilizers for recessionary gaps:
Unemployment Insurance
Temporary Assistance
Automatic stabilizers for inflationary gaps:
Income Taxes
People are earning more income, so you would imagine they would have more disposable income. However, this is not true. When there is an inflationary gap, where individuals are working more and earning more income, the government can impose more income taxes in order to decrease consumption.
Corporate Taxes
Businesses are earning more profit, so you would imagine they would be investing more. However, this is not true. When there is an inflationary gap, where businesses are producing more and earning more, the government can impose more corporate taxes in order to decrease investment.
Decreases in Unemployment Insurance
Transfer payments
Not counted in GDP
Are intended to assist individuals most hurt in economic downturns.
When individuals are unemployed, unemployment insurance is one form of transfer payment that puts money in people’s hands - if people choose to spend that money on goods and services, then consumption can increase.
NOT A GUARANTEE: That increase won’t always increase consumption!! APC!!!
Imagine that business investment has fallen. This directly results in more unemployment. How would this affect transfer payments? Why, it would increase them! Because more people are seeking out assistance, the system will need to increase transfer payments in order to get the economy back to full employment.
Capital Stock
the accumulation of physical capital, like factories, tools, and equipment, used to produce goods and services. In economics, capital is never money.
Negative Supply Shock
an unexpected decrease in the availability of a key resource. This causes a decrease in the SRAS.
Positive supply shock
an unexpected increase in the availability of a key resource. This causes an increase in the SRAS.