Tags & Description
Aggregate
“added all together”
When we use it, we combine all the prices and all quantities
Aggregate Demand
All the goods and services (real GDP) that buyers are willing and able to purchase at different price levels
What is the relationship between price level and real GDP?
There is an inverse relationship
If the price level:
Increases (inflation), then real GDP demand falls as people buy less
Decreases (deflation), then real GDP demand increases as people spend more
What are the three reasons why AD is downward sloping?
The Wealth Effect
Interest Rate Effect
Foreign Trade Effect
The Wealth Effect
Higher price levels reduce the purchasing power of money, which decreases the quantity of expenditures
Lower price levels increase purchasing powers and increase expenditures
AKA Real Balance Effect
Price level goes up and GDP demanded goes down
The Interest Rate Effect
When the price level increases, lenders need to charge a higher interest rate to get a REAL return on their loans
High interest rates discourage consumer spending and business investment
Price level goes up and GDP demanded goes down
The Foreign Trade Effect
When U.S. price level rises, foreign buyers purchase fewer U.S. goods and Americans buy more foreign goods
Exports fall and imports rise causing real GDP demanded to fall (Xn decreases)
Price level goes up and GDP demanded goes down
Shifters of Aggregate Demand
Consumer Spending
Increase in disposable income
Consumer expectations
Household indebtedness
Income taxes
Investment Spending
Real interest rates
Future business expectations
Productivity and technology
Business taxes
Government Spending
Government expenditures
Transfer payments NOT included
Net Exports
Exchange rates
National income compared to abroad
Multiplier Effect
Shows how spending is magnified in the economy
Marginal Propensity to Consume (MPC)
MPC = Change in consumption / Change in disposable income
How much people consume rather than save when there is a change in disposable income
Marginal Propensity to Save (MPS)
MPS = Change in savings / Change in disposable income
How much people save rather than consume when there is a change in disposable income
Spending multiplier formula
1 / MPS or 1 / 1 - MPC
Total change in GDP formula
Multiplier × Initial change in spending
Tax Multiplier × Initial change in taxes
Tax multiplier formula
MPC / MPS or Spending Multiplier - 1
Why is the tax multiplier weaker than the spending multiplier?
It is weaker because some people won’t spend all the money they get from an increase in their disposable income (unless transfer payments)
Aggregate Supply
The amount of goods and services (real GDP) that firms will produce in an economy at different price levels. The supply for everything by all firms
Short-run Aggregate Supply
Wages and resource prices are sticky and WILL NOT change as price levels change
Long-run Aggregate Supply
Wages and resource prices are flexible and WILL change as price levels change
Price level increases but GDP doesn’t (vertical curve)
Considered to be the production of the economy at full employment (maximum sustainable capacity)
Current output = potential output
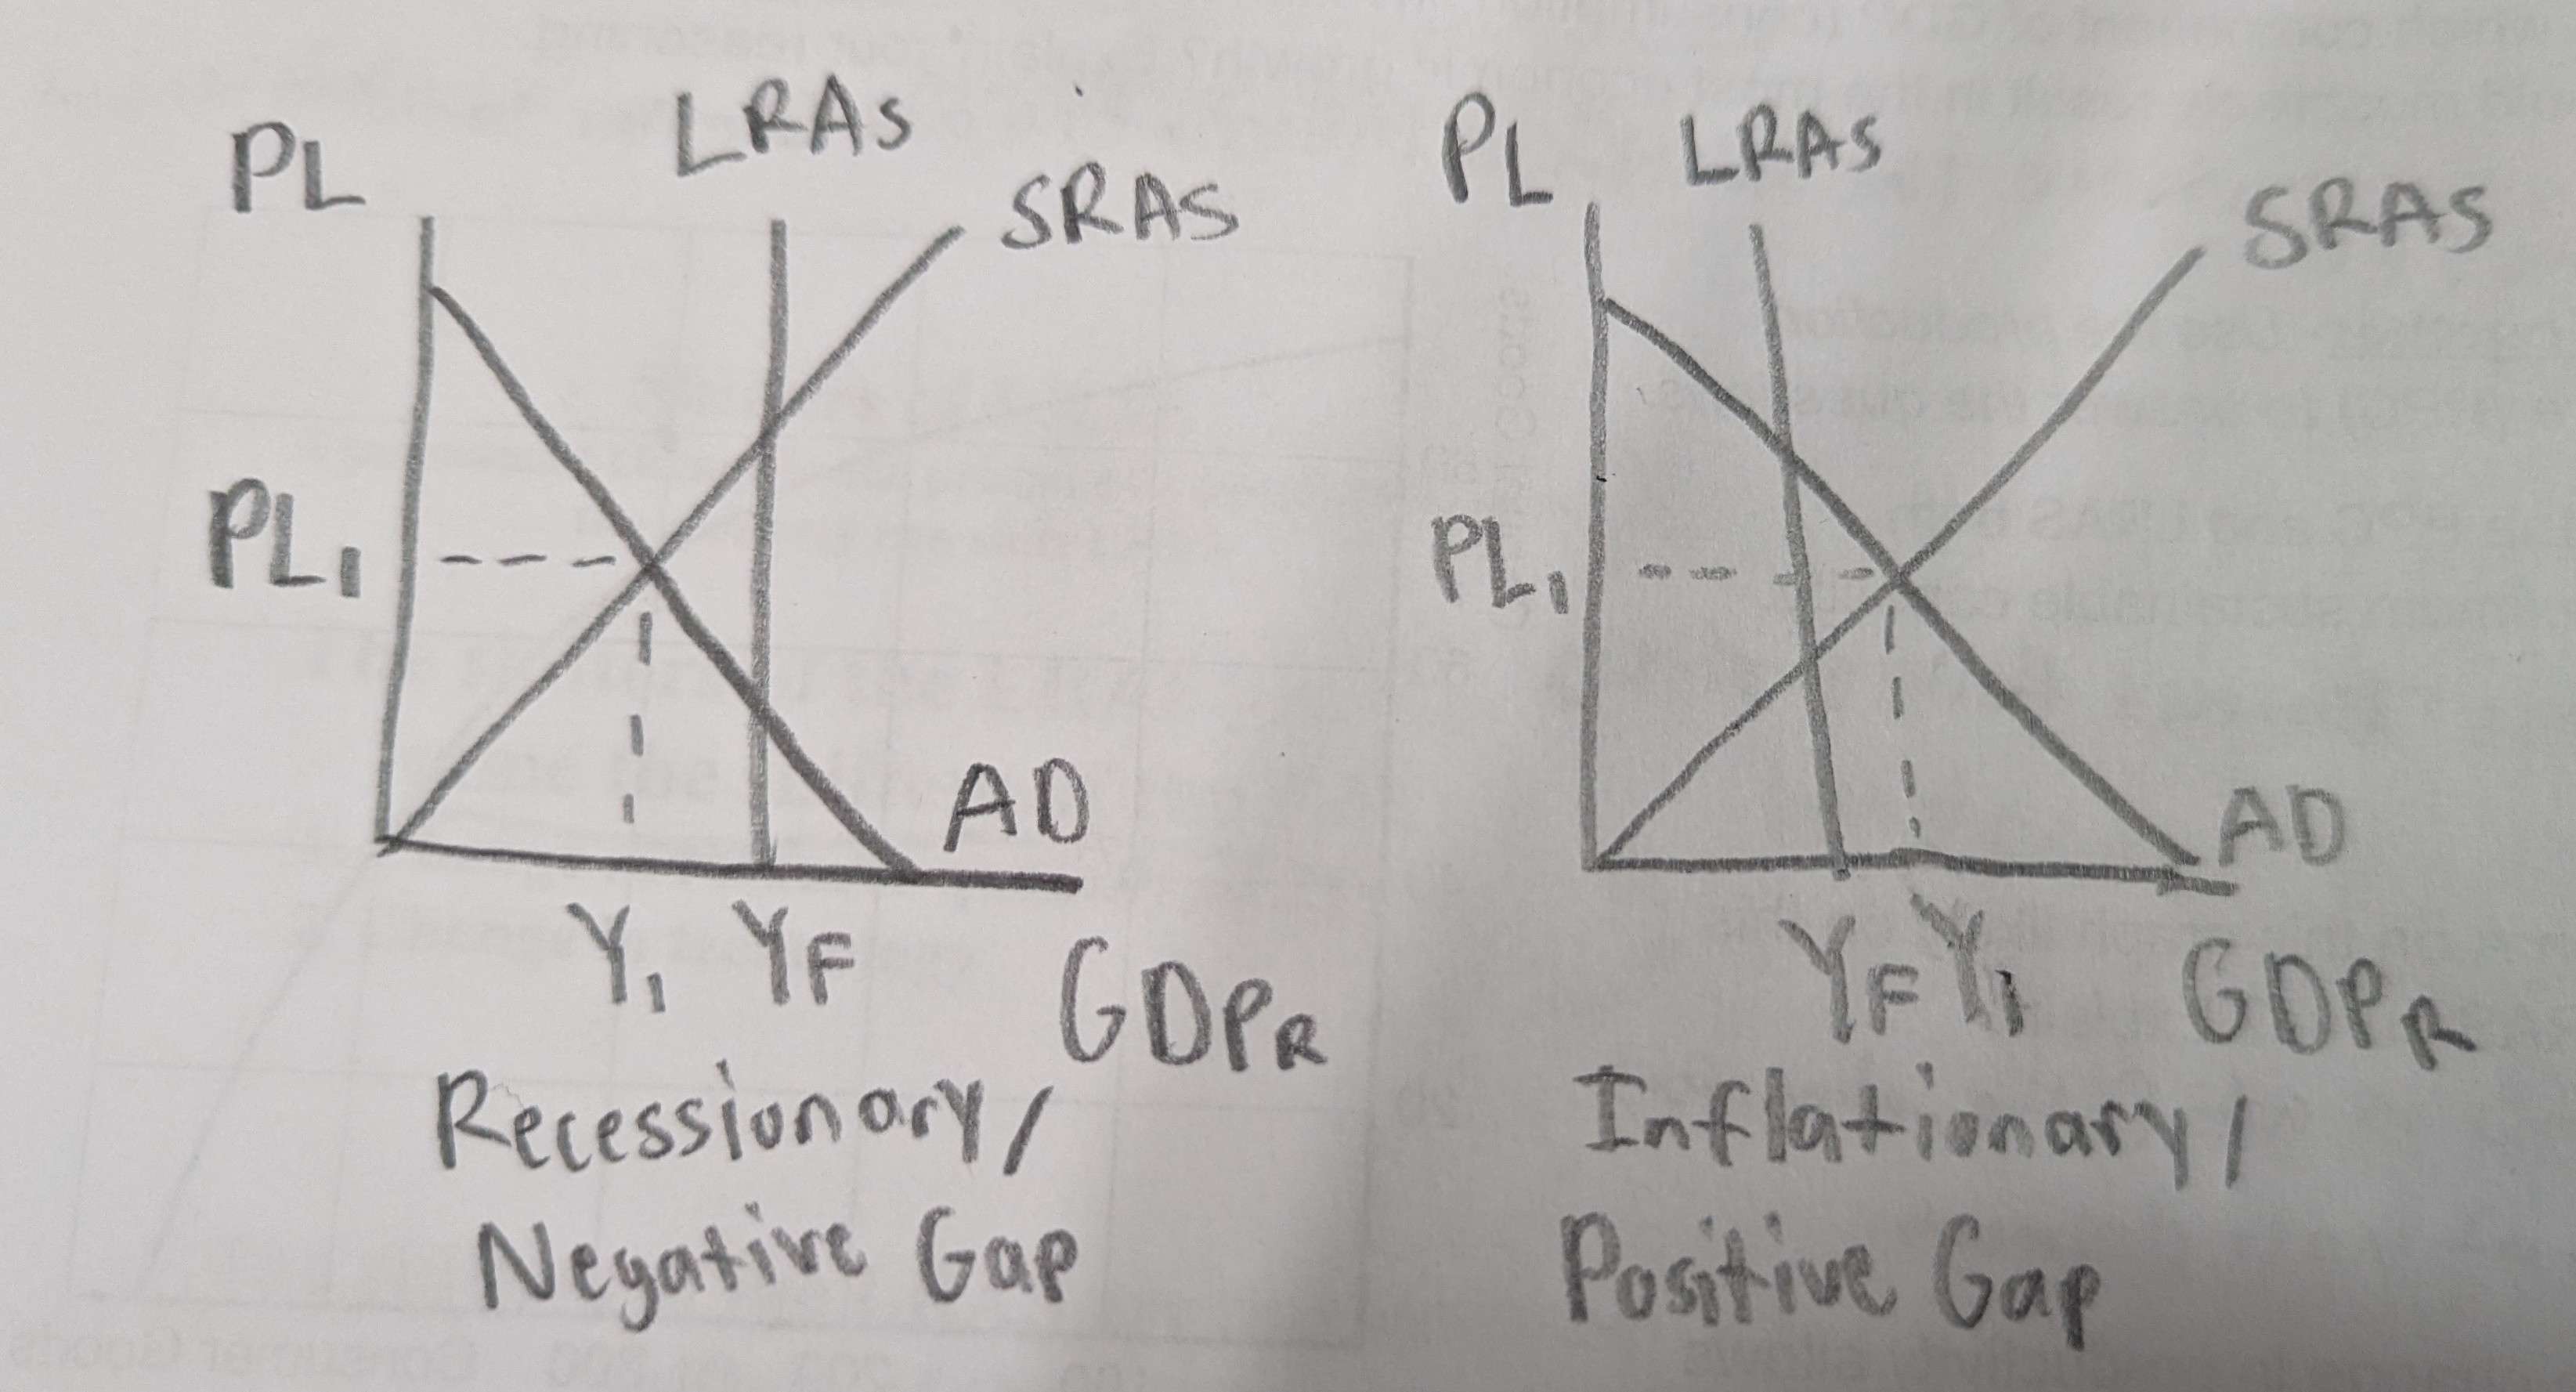
When Yc < Yf, the economy is in a recessionary/negative gap
When Yc > Yf, the economy is in an inflationary/positive gap
Shifters of Short-run Aggregate Supply
Change in Resource Prices
Prices of domestic and imported resources
Supply shocks
Inflationary expectations
Workers will demand higher wages if consumers and producers expect higher prices in the future
Change in Actions of the Government
Taxes on producers
Subsidies for domestic producers
Government regulations
Change in Productivity
Technology
Shifters of Long-run Aggregate Supply
A permanent in the production possibilities of the economy can shift LRAS
Only investment causes growth since firms increase their capital stock
Same as the shifters of the PPC
Change in resource quantity or quality
Change in technology
Stagflation
A mix of high inflation and a stagnant economy
Still considered a recessionary gap
Hard to correct, since inflation and recession are dealt with differently
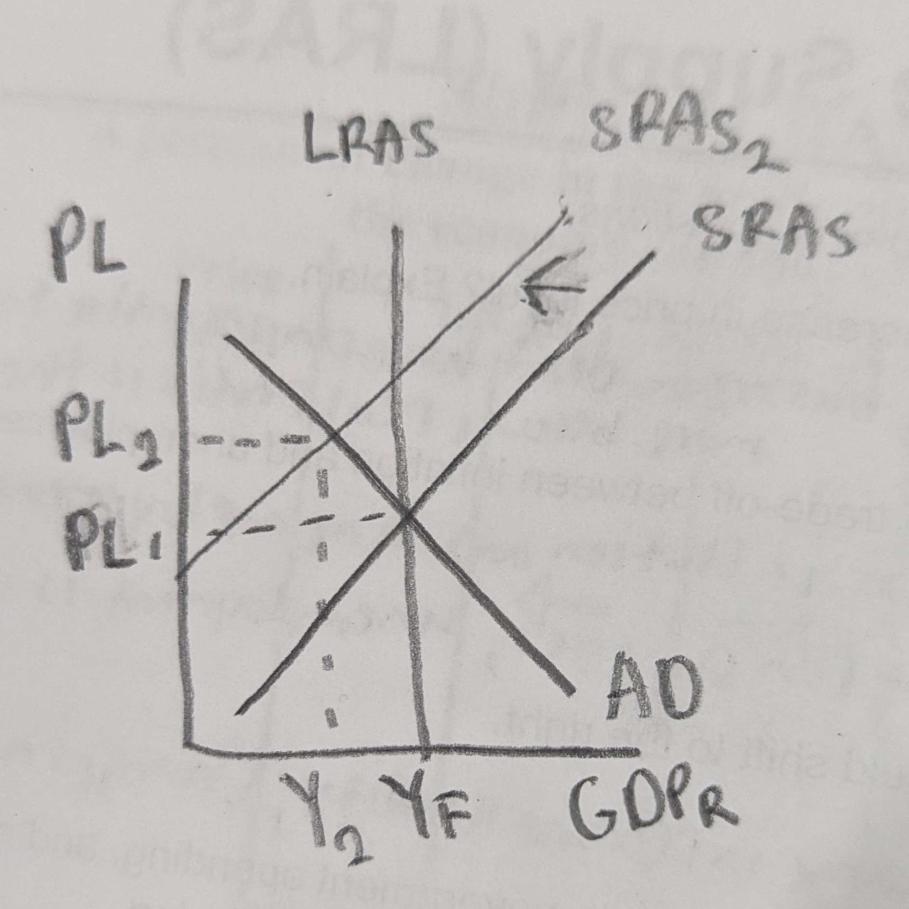
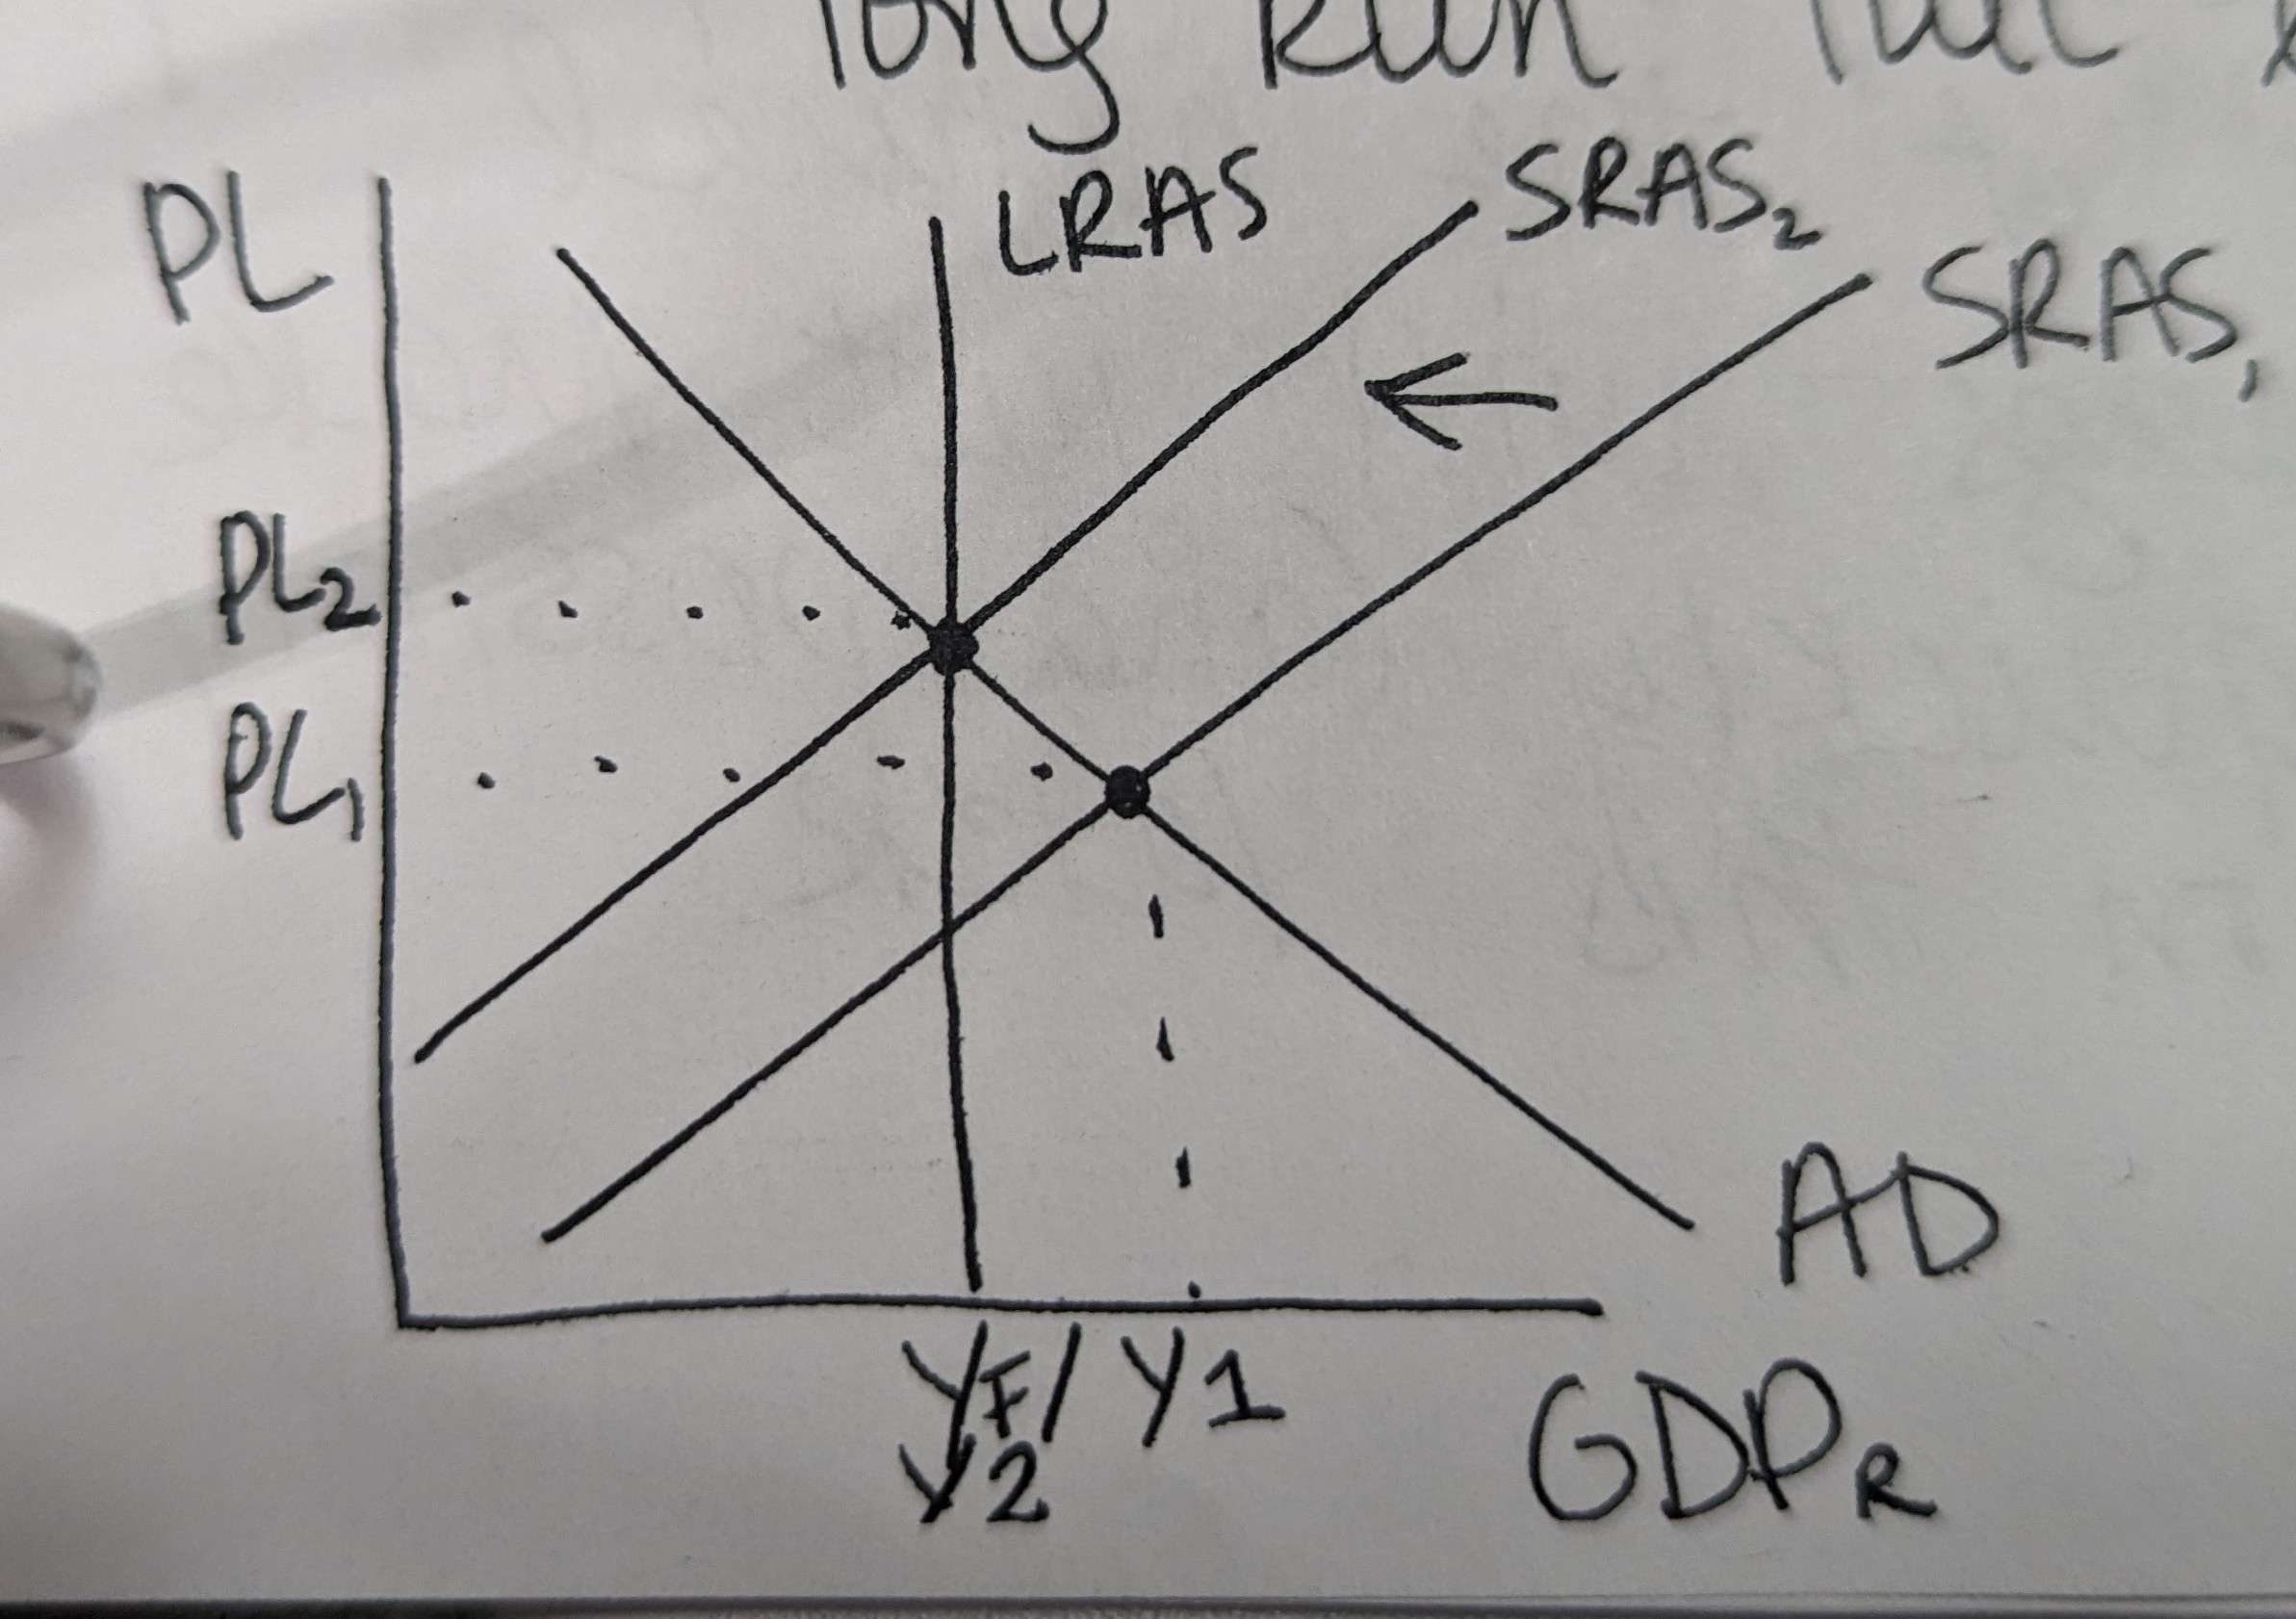
Long-Run Self-Adjustment
In the long-run, the economy will always self-adjust, even if there is no policies implement by the government (it just adjusts more slowly)
Positive and negative output gaps will slowly adjust back to the full employment level over time
Picture shows long-run self adjustment on a positive output gap (SRAS decreases due to an increase in PL)
Autonomous consumption
Consumers will spend a certain amount no matter what, regardless of their income (usually paying for their necessities)
Disposable income
Income after taxes
Consumer Spending formula
Autonomous consumption + Disposable income
Fiscal Policy
Actions by congress to stabilize the economy (laws)
Monetary Policy
Actions by the Federal Reserve Bank to stabilize the economy
Discretionary Fiscal Policy
Congress creates a new one time bill/law that is designed to change AD through government spending or taxation
One problem is lag times due to
bureaucracy
It takes time for Congress to act
Non-Discretionary Fiscal Policy (Automatic Stabilizers)
Permanent spending/taxation laws enacted to work counter cyclically to stabilize the economy
When GDP Goes down, government spending automatically increases and taxes automatically fall
Contractionary Fiscal Policy
Laws that reduce inflation, decrease GDP (close an inflationary gap)
Decrease government spending
Increase taxes (decreasing disposable income)
Expansionary Fiscal Policy
Laws that reduce unemployment and increase GDP (close a recessionary gap)
Increase government spending
Decrease taxes (increasing disposable income)
The three lags of Fiscal Policies:
Recognition Lag
Administrative Lag
Operational Lag
Recognition Lag
Congress must react to economic indicators before it’s too late
Administrative Lag
Congress takes time to pass legislation
Operational Lag
Spending/planning takes time to organize and execute (changing taxing is quicker)
Progressive Income Tax System
When GDP is down, the tax burden on consumers is low, which promotes consumption and increases AD and vice versa
Unemployment benefits and social service programs (automatic stabilizer)
When GDP is down, unemployment is higher and more benefits are payed out, which increases AD and vice versa