Analyzing Enzyme Graphs And Diagrams
Gibbs Free Energy Graphs
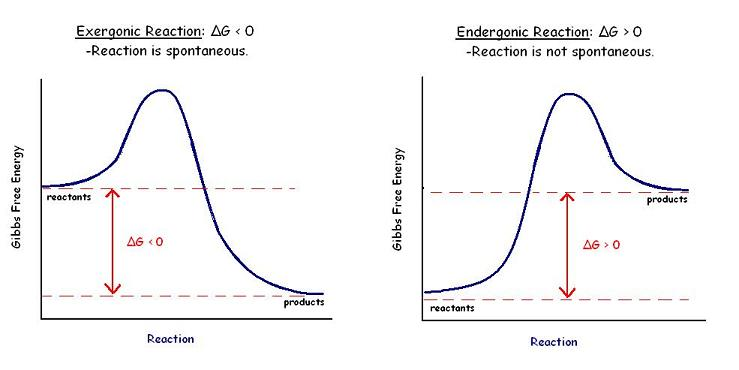
The Gibbs free energy graph shows whether or not a reaction is spontaneous-- whether it is exergonic or endergonic. Therefore, if the reaction goes from higher free energy to lower free energy, there will be a negative ΔG, and the reaction will be spontaneous. A positive ΔG indicates that the reaction is endergonic, or that it requires energy to go from reactants to products.
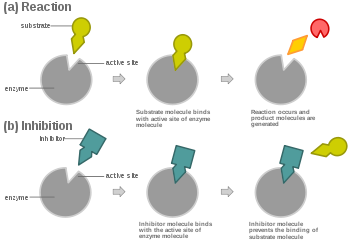
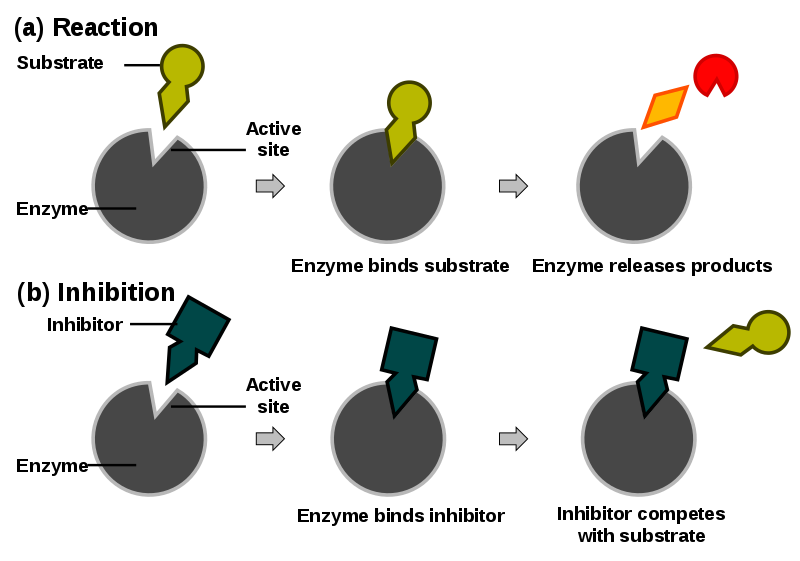
Inhibitor diagrams
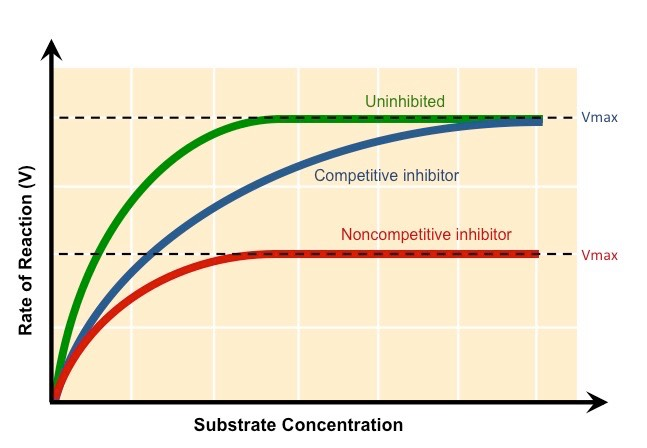
Inhibitor graph analysis
Competitive Inhibitor: The rate of reaction is reduced as the inhibitor competes with the substrate, Maximum rate can be achieved if substrate levels are high enough
Non-Competitive Inhibitor: The rate of reaction is reduced as the enzyme's active site is altered, Maximum rate cannot be achieved by raising substrate levels
Temperature Graph
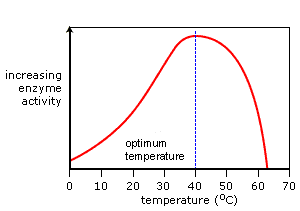
As the temperature increases so do the rate of enzyme activity. Optimum activity is reached at the enzyme's optimum temperature. A continued increase in temperature results in a sharp decrease in activity as the enzyme's active site changes shape. It is now denatured.
pH Graph
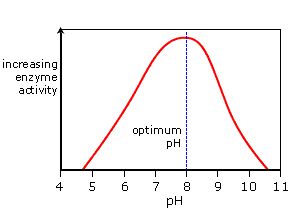
In the graph above, as the pH increases so do the rate of enzyme activity. Optimum activity is reached at the enzyme’s optimum pH, pH 8 in this example. A continued increase in pH results in a sharp decrease in activity as the enzyme’s active site changes shape. It is now denatured.
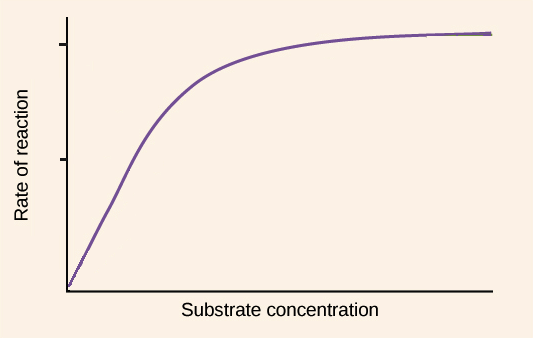
Substrate Graph
As the substrate concentration increases so do the rate of enzyme activity. An optimum rate is reached at the enzyme’s optimum substrate concentration. A continued increase in substrate concentration results in the same activity as there are not enough enzyme molecules available to break down the excess substrate molecules.