
02: Quadratic Functions
Ordered pair: a set of independent (x) values that represent a relationship
Relation: a set of inputs (x) and outputs (y)
Function: a relation with one output (y) for each input (x) and no x value may be repeated
Identifying Functions
With points: no x values can be the same or repeat
With a graph: must pass the vertical line test
→ Vertical line test: draw a vertical line through the graph, cutting through it. If it intersects at more than 1 point then it fails the test and thus is not a function
Function Notation
The way that a function is written → f(x) is essentially our new y
f(x) can also be a value, f(value), and you would then substitute that value in for x
Domain and Range of Functions
Domain: every x value your function is allowed to be
Range: every y value your function is allowed to be
Use:
< less than
≤ less than or equal to
to set these boundaries of what your x and y values can be respectively
Properties of Quadratic Functions
The quadratic function becomes a U-shaped parabola when graphed
Forms:
Standard Form:
f(x) = ax² + bx + c where a ≠ 0
c is y intercept
Cannot graph from this form
Factored Form:
f(x) = a(x-r)(x-s)
x intercepts are (r,0) and (s,0)
To find the y intercept, let x = 0
Can graph from this form
Vertex Form:
f(x) = a(x-h)² + k
Vertex is (h,k)
To find y intercept, let x = 0
Can graph from this form
Direction of Opening, a’s Sign:
If a is negative, parabola opens downwards and has a maximum (max frowns and is negative)
If a is positive, parabola opens upwards and has a minimum
The min or max value is also the y value of the vertex
Axis of Symmetry (AOS):
The value of the x value at the vertex of the parabola (at which the function is at its min or max value)
Formula: (r + s)/2
Profit and Revenue
Revenue: the total amount of money taken in
Cost: the amount of money paid for goods or expenses
Profit: the amount of money left after expenses → revenue - cost
Revenue
Revenue = selling price x number of items
Let x represent the number of [value] increases or decreases
Chart:
Old | New | |
|---|---|---|
Selling Price | Value | Old + or - [value]x |
Number of Items | Value | Old + or - [value]x |
If it is an increase, +
If it is a decrease, -
Find x intercepts → (new selling price)(new number of items) → solve by making it equal to zero
Find AOS by adding both points and dividing by 2 → (r+s)/2
Find new selling price or number of items by substituting in your new AOS value into either “new” equation on the chart (depending on what you want to find)
Profit
Profit = profit per item x number of items
Let x represent the number of [value] increases or decreases
Chart:
Old | New | |
|---|---|---|
Profit Per Item | Value | Old + or - [value]x |
Number of Items | Value | Old + or - [value]x |
3. Find x intercepts → (Profit per item)(number of items) and solve by making x = 0
Find AOS by adding both points and dividing by 2 → (r+s)/2
Substitute back into chart “new” equations for new Profit Per Item or new Number of Items
Solving Quadratic Equations
Factoring: Make the equation = to zero and factor, take your factored brackets and make them = to zero, isolate x
Quadratic formula: make the equation = to zero and plug into the following formula
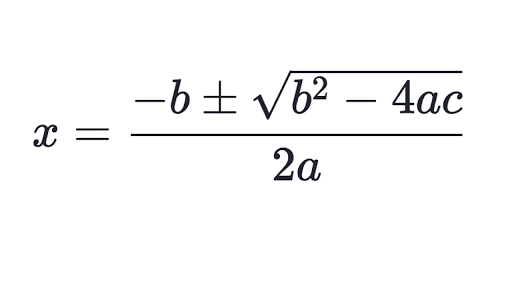
Zeroes of a Quadratic Function
The radicand in quadratic formula is the discriminant → b² - 4ac
The value of the discriminant is an indication of the number of solutions
Positive Discriminant: 2 solutions, real and unequal roots
Discriminant = Zero: 1 solution, real and equal roots
Negative Discriminant: no solutions, imaginary roots
Discriminant with K
Find K by making D=0 → becomes a new quadratic
Draw a chart to find D>0 and D<0 (remember: the value of something that has been square root’ed is both positive and negative)
K | Pick and Plug, less than found (negative) | Found (negative) | Pick and plug, in between positive and negative | Found (positive) | Pick and plug, more than found (positive) |
|---|---|---|---|---|---|
D | Calculate | 0 | Calculate | 0 | Calculate |
< < < < <Linear Quadratic Systems
Solve algebraically:
Make both expressions = to each other
Smoosh both equations together (make equal to zero) and solve y
Get your x value of the point
Find the y value of the point by substituting x into either equation