Tags & Description
types of bias - voluntary response bias
when only those that choose to participate do participate. Those that choose to participate feel very strongly one way or the other.
types of bias - response bias
when participants are put in a position that makes them uncomfortable to respond truthfully. Poorly worded questions would also lead to response bias.
types of bias - undercoverage bias
when certain groups are left out of a survey often due to the difficulty in including them.
types of bias - selection bias
when one group is more heavily studied than any other group
Randomization
to reduce bias - the use of chance or probability during the selection process
simple random samples
BEST METHOD - number all possible subjects in the population. Then use a random number generator or table of random digits to selects a specified number from the population. All possible combinations are possible. The chance of getting a biased group is small and taken into consideration with a statistic called the sampling error or the standard deviation of the sample.
stratified random sample
when we first group the subjects by some similar characteristic then take a random sample from each group (EX. grouping subjects by sex then randomly selecting 20 males and 20 females). This is done for COMPARISON purposes.
systematic random sample
often done for convenience. Like chooseing every 10th subject ya know?
cluster sampling
first splitting the population into similar groups, then completing a census of the groups selected. For instance, second block Westwood students are seperated into clusters (classes). Randomly select 5 classes and survey everyone in each of the 5 classes.
blocking
to reduce variation - creating groups that are similar with respect to a particular variable. Blocking is when groups that are already similar in some ways are grouped together. This technique helps control certain lurking or confounding variables and limits the variation in the study statistics. (Pretty much the same as stratifying when you choose a sample.)
control group
to reduce the effects of confounding variables - a group that receives no treatments or a placebo treatment.
blindness
to reduce bias - when the subject, the evaluator, or both (double blind) do not know which treatment is being administered). This is done so neither the subject nor the researcher can bias the study for or against the new drug. (Bias is often not intentional.)
Describe confounding variables
When there is uncertainty with regard to which variable is causing an effect, we say the variables are confounded. IMPORTANT: In order to receive credit for a confounding variable, you must describe how it confounds the data AND relate the results to BOTH groups.
Generalizability
Results may only be generalized to the population randomly selected. If we study only Westwood students we may draw conclusions about only Westwood students, not all high school students.
Experiments vs Observational Studies
Experiments impose a treatment on the subject or experimental unit. only a well-designed, controlled experiment can show a casual relationship.
Quantitative vs Categorical Variables
Quantitative Variables are numberical values for which arithemetic operations such as mean make sense. It is usually a measure of some sort.
Categorical variables simply count which of several categories a person or thing falls.
When looking at a distribution…
locate the center
examine the overall shape
check for gaps and outliers
describe the spread.
Frequency graph measures…
the number count of data in each bar
relative frequency graph measures…
the number represnts the PERCENT of data in each bar
How do you know if a point is an outlier (calculation)?
Q3 + 1.5*IQR
or
Q1 - 1.5*IQR
Find the Standard Deviation of: 23, 36, 21, 40, 27
First find the mean: 29.4
Subtract the mean from each number then square it: 40.96, 43.56, 70.56, 112.36, 5.76
Find the sum of the squared deviation scores: 273.2
Divide the sum by n-1: 68.3
Take the square root for the standard deviation: 8.234 (rounding error)
Formula for z-table problem thing
(x-μ)/σ
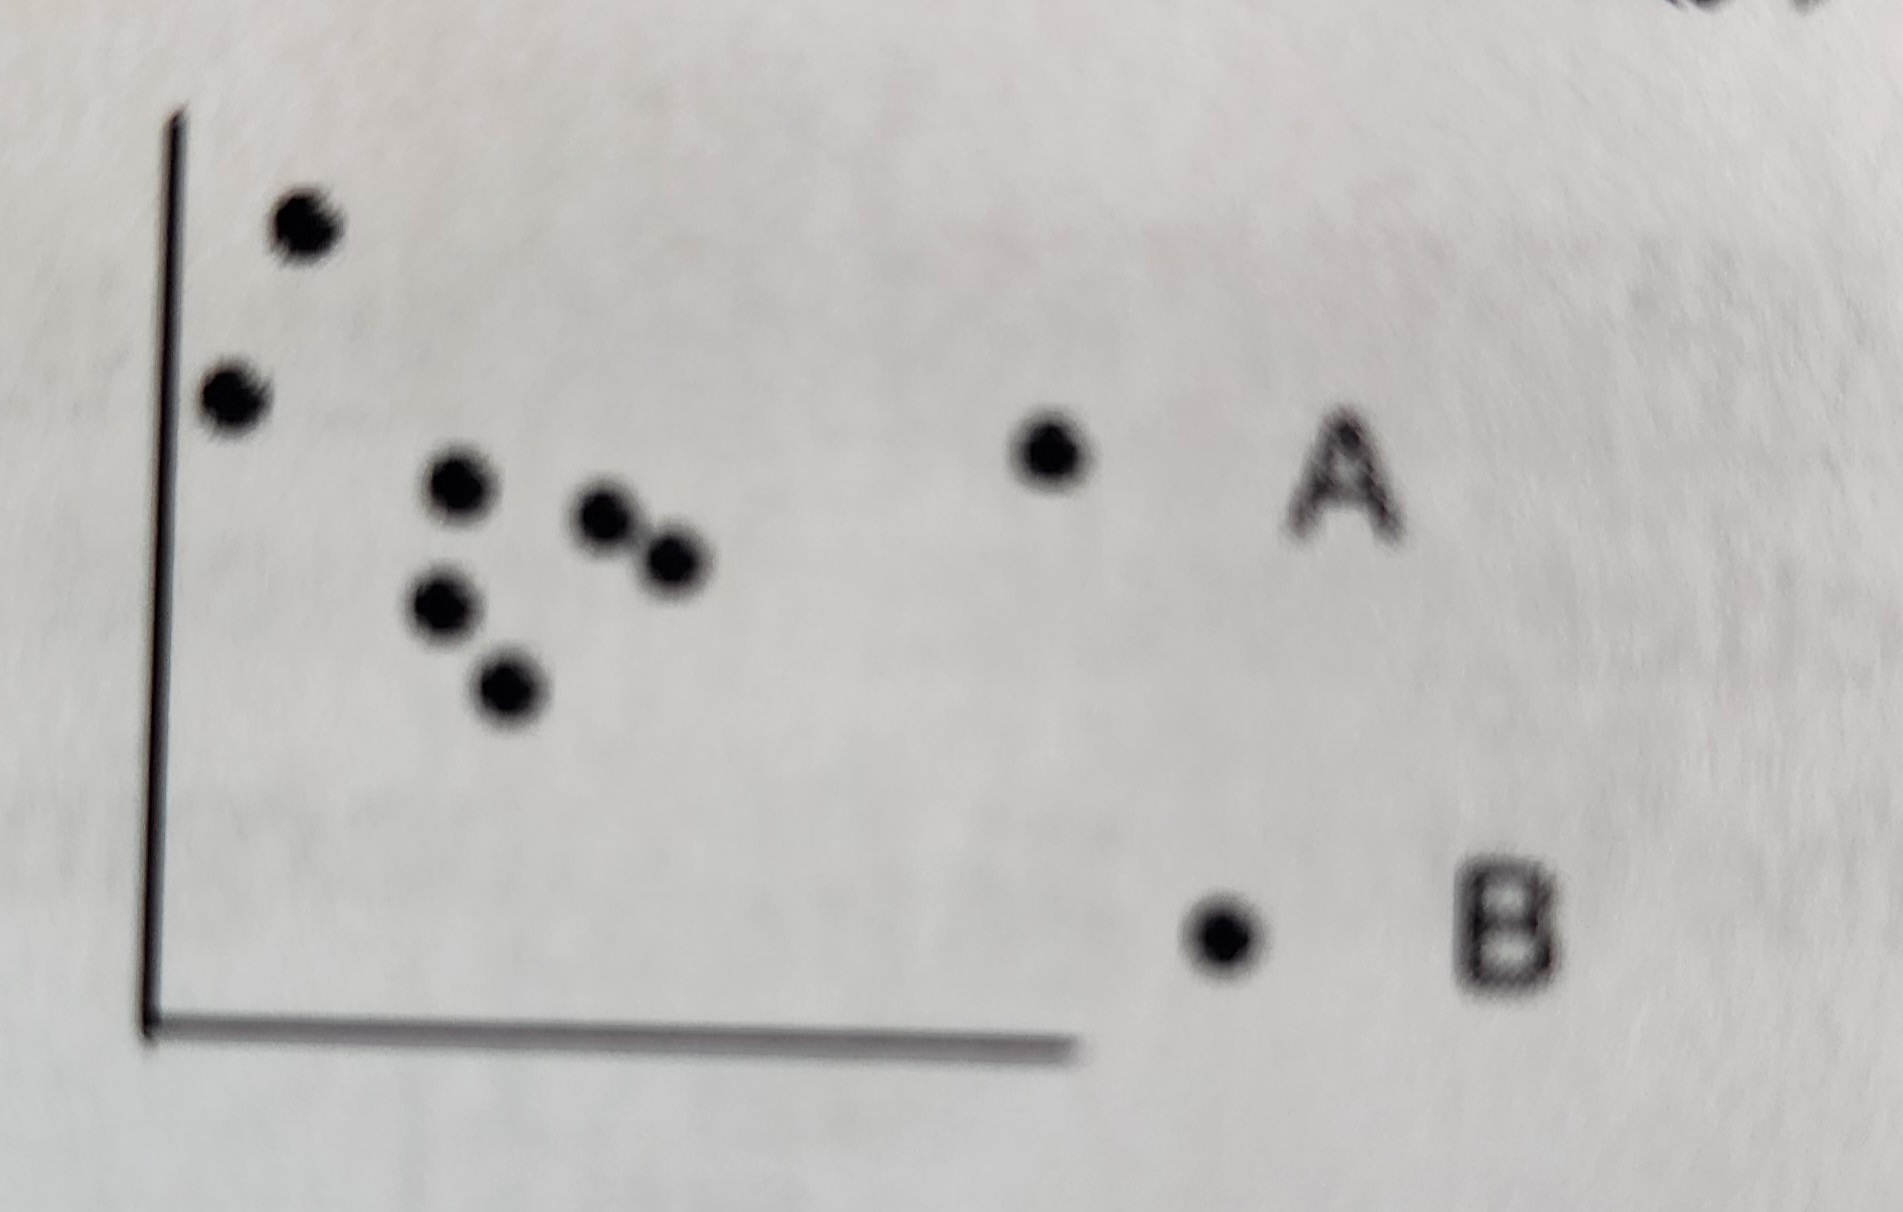
Linear Regression (Bivariate Data) - Would it be most appropriate to removie case A or case B?
Case A because it is an outlier. (Case B is an influential point)
Linear Regression (Bivariate Data) - Do the points have a positive or negative association, why?
Negative, slope is negative
What does the “least squares regression” line mean?
The sum of the squared residual is the smallest possible
If a set of points has a least squares regression equation of y = 2.3x +17, what is the residual of the actual point (3, 19.5)?
Would this point be above or below the linear regression line?
Residual = observed - predicted
y(predicted) = 2.3(3) + 17
y(predicted) = 23.9
19.5 - 23.9 = -4.4
Below because residual is negative
P(A u B) =…
P(A) + P(B) - P(A n B)
P(A n B) =…
P(A) * P(B)
P(A | B) =…
P(A n B)/P(B)
If P(A) and P(C) are independant, than…
P(A n C) = P(A) * P(C)
How do you calculate the difference between means?
μ(x-y) = μ(x) - μ(y)
How do you calculate the difference between standard deviations?
σ(x-y)^2 = √(σ(x)^2 + σ(y)^2)
Central Limit Theorem
The central limit theorem states that if you take sufficiently large samples from a population (n>or=30), the samples’ means will be normally distributed, even if the population isn’t normally distributed.
Standard Deviation for a sampling distribution
σ(X̄) = σ/√n
Type I Error
When Ho is true, but you go with Ha
Type II Error
When the alternative Ha, is true but you go with Ho
Mean of the Sample Proportions
μ(phat)=p
Standard Deviation of the Sample Proportions
σ(phat) = √(pq/n)
IRTS
Independence
Random
Ten % Rule
Success/Failure Rule: np>_10 & nq>_10
One Sample Proportion: “What's the probability that the sample proportion is less than/greater than #?”
Check IRTS
Define phat
Find 4 values:
μ(phat)=p, σ(phat)=√(pq/n), z= (phat-μ(phat))/σ(phat)
normalcy
Sentence in context