*note that this does not include everything, I have omitted some small parts since this was for my personal use
Financial Sector
Network of institutions that link borrowers and lenders. Includes banks, mutual funds, pension funds, and other financial intermediaries.
Assets
Anything tangible or intangible that has value.
Interest Rate
The amount a lender charges borrowers for borrowing money. It’s the “price” of a loan.
Interest
Assets that earn interest over time. e.g. bonds. (bearing assets)
Investment
In econ, it will always refer to business spending on tools and machinery. A low interest rate will increase this.
Liquidity
The ease with which an asset can be converted to a medium of exchange. In general, the higher this is, the lower the rate of return.
Bonds
(AKA securities) are loans, or IOUs, that represent debt that the government, business, or individual must repay to the lender.
The bond holder has no ownership of the company and is paid interest
To get more money, you could sell half of your company and issue shares of stock
Bonds Prices and Interest Rates
Bond price and interest rates are inversely related because a bond is issued at a specific interest rate that doesn’t change throughout the life of the bond.
Real Interest Rates
The percentage increase in purchasing power that a borrower pays (adjusted for inflation).
Real Interest Rates Formula
Nominal interest rate - expected inflation
Nominal Interest Rates
The percentage increase in money that the borrower pays (not adjusted for inflation).
Nominal Interest Rate Formula
Real interest rate + expected inflation
Money
It is anything that is generally accepted as payment for goods and services. It is not the same as wealth or income.
Wealth
It is the collection of assets.
Income
It is a flow of earnings per unit of time.
Commodity Money
Something that performs the function of money and has intrinsic (natural) value.
Examples: Gold, silver, cigarettes, etc.
Fiat Money
Something that serves as money but has no other value or uses.
Examples: Paper Money, Coins, Digital Currency
The Functions of Money
A medium of exchange
Money can easily be used to buy goods and services with no complications of barter system.
A unit of account
Money measures the value of all goods and services. Money acts as a measurement of value.
A store of value
Money allows you to store purchasing power for the future.
The Barter System
Goods and services are traded directly; no money is exchanged.
The reasons why money is effective
Generally Accepted
Buyers and sellers have confidence that it IS legal tender.
Scarce
Money must not be easily reproduced.
Portable and Dividable
Money must be easily transported and divided.
The Purchasing Power of money
It is the amount of goods and services a unit of money can buy. Inflation decreases purchasing power, and hyperinflation decreases acceptability.
Classifying/measuring money
M0
Monetary base
M1 (Highest Liquidity)
Currency in circulation
Checking accounts/demand deposits
Savings accounts
M2 (Near-Moneys)
Consists of M1
Small denomination time deposits
Retail money market funds
M4
Consists of M1 and M2
Larger time deposits
Larger liquid assets
M1 and M2 money often earn little to no interest so the opportunity cost of holding liquid money is the interest you could be earning
Federal Reserve Banking
When banks hold a portion of deposits to cover potential withdrawals and then loan the rest of the money out
Money Multiplier
1 / Reserve Requirement (ratio)
Demand Deposits
Money deposited in a commercial bank in a checking account
Required Reserves
The percentage that banks must hold by law
Excess Reserves
The amount that the bank can loan out
Balance Sheet
A record of a bank’s assets liabilities, and net worth
Required Reserve Ratio
Required Reserves / Demand Deposits
Transaction Demand for Money
People hold money for everyday transactions
Asset Demand for Money
People hold money since it is less risky than other assets
What happens to quantity demanded of money when interest rates increase?
Quantity demanded falls because individuals would prefer to have interest-earning assets instead
What happens to the quantity demanded when interest rates decrease?
Quantity demanded increases. There is no incentive to convert cash into interest earning assets
Shifters of Money Demand
Change in price level
Changes in income
Changes in technology
Shifters of Money Supply
Changes in the money supply through actions of the Central Bank
Reserve Ratio: % of deposits banks must hold in reserve
Discount Rate: the interest rate the central bank charges other banks for lending
Open Market Operations: the central bank buys or sells bonds
Monetary Policy
A central bank’s policies of influencing interest rates to help achieve macroeconomic objectives:
Price stability (low and stable rate of inflation)
Full employment (being at the natural rate of unemployment)
Expansionary Monetary Policy
The central bank decreases nominal rates in the short run to help get an economy out of a recessionary gap
Lower interest rates -> Less expensive to borrow -> More interest-sensitive spending -> AD increase
Contractionary Monetary Policy
The central bank increases nominal rates in the short run to help bring an economy out of a inflationary gap
Higher interest rates -> More expensive to borrow -> Less interest-sensitive spending -> AD decrease
Monetary Policy Lags
Recognition Lag
It takes time for central banks to collect and analyze the data needed to recognize problems in the economy
Impact Lag
It takes time for the economy to adjust after the policy action is taken
Limited Reserve Banking
Before 2008, commercial banks held very few reserves with the central bank, instead opting to loan that money to customers or other banks.
A small change in the money supply would have a noticeable effect on the interest rate.
This is because when the central bank bought bonds from commercial banks, that money would be immediately loaned out, which increases the money supply.
Banks have a reserve requirement
Normal monetary policy tools are able to change the supply of excess reserves, which changes the money supplied
Ample Reserve Banking
After 2008, commercial banks held a lot of reserves with the central bank
This is because the FED started to pay interest on those reserves, allowing commercial banks to deposit their extra money with the federal reserve to earn interest (IOR).
Banks do not have a reserve requirement
Different monetary tools are required to shift the money supply
Changing the money supplied does not lead to changed in the nominal interest rate
Central banks have to change their administered rates
Interest on Reserves (IOR)
The interest rate that the central bank pays commercial banks to hold reserves.
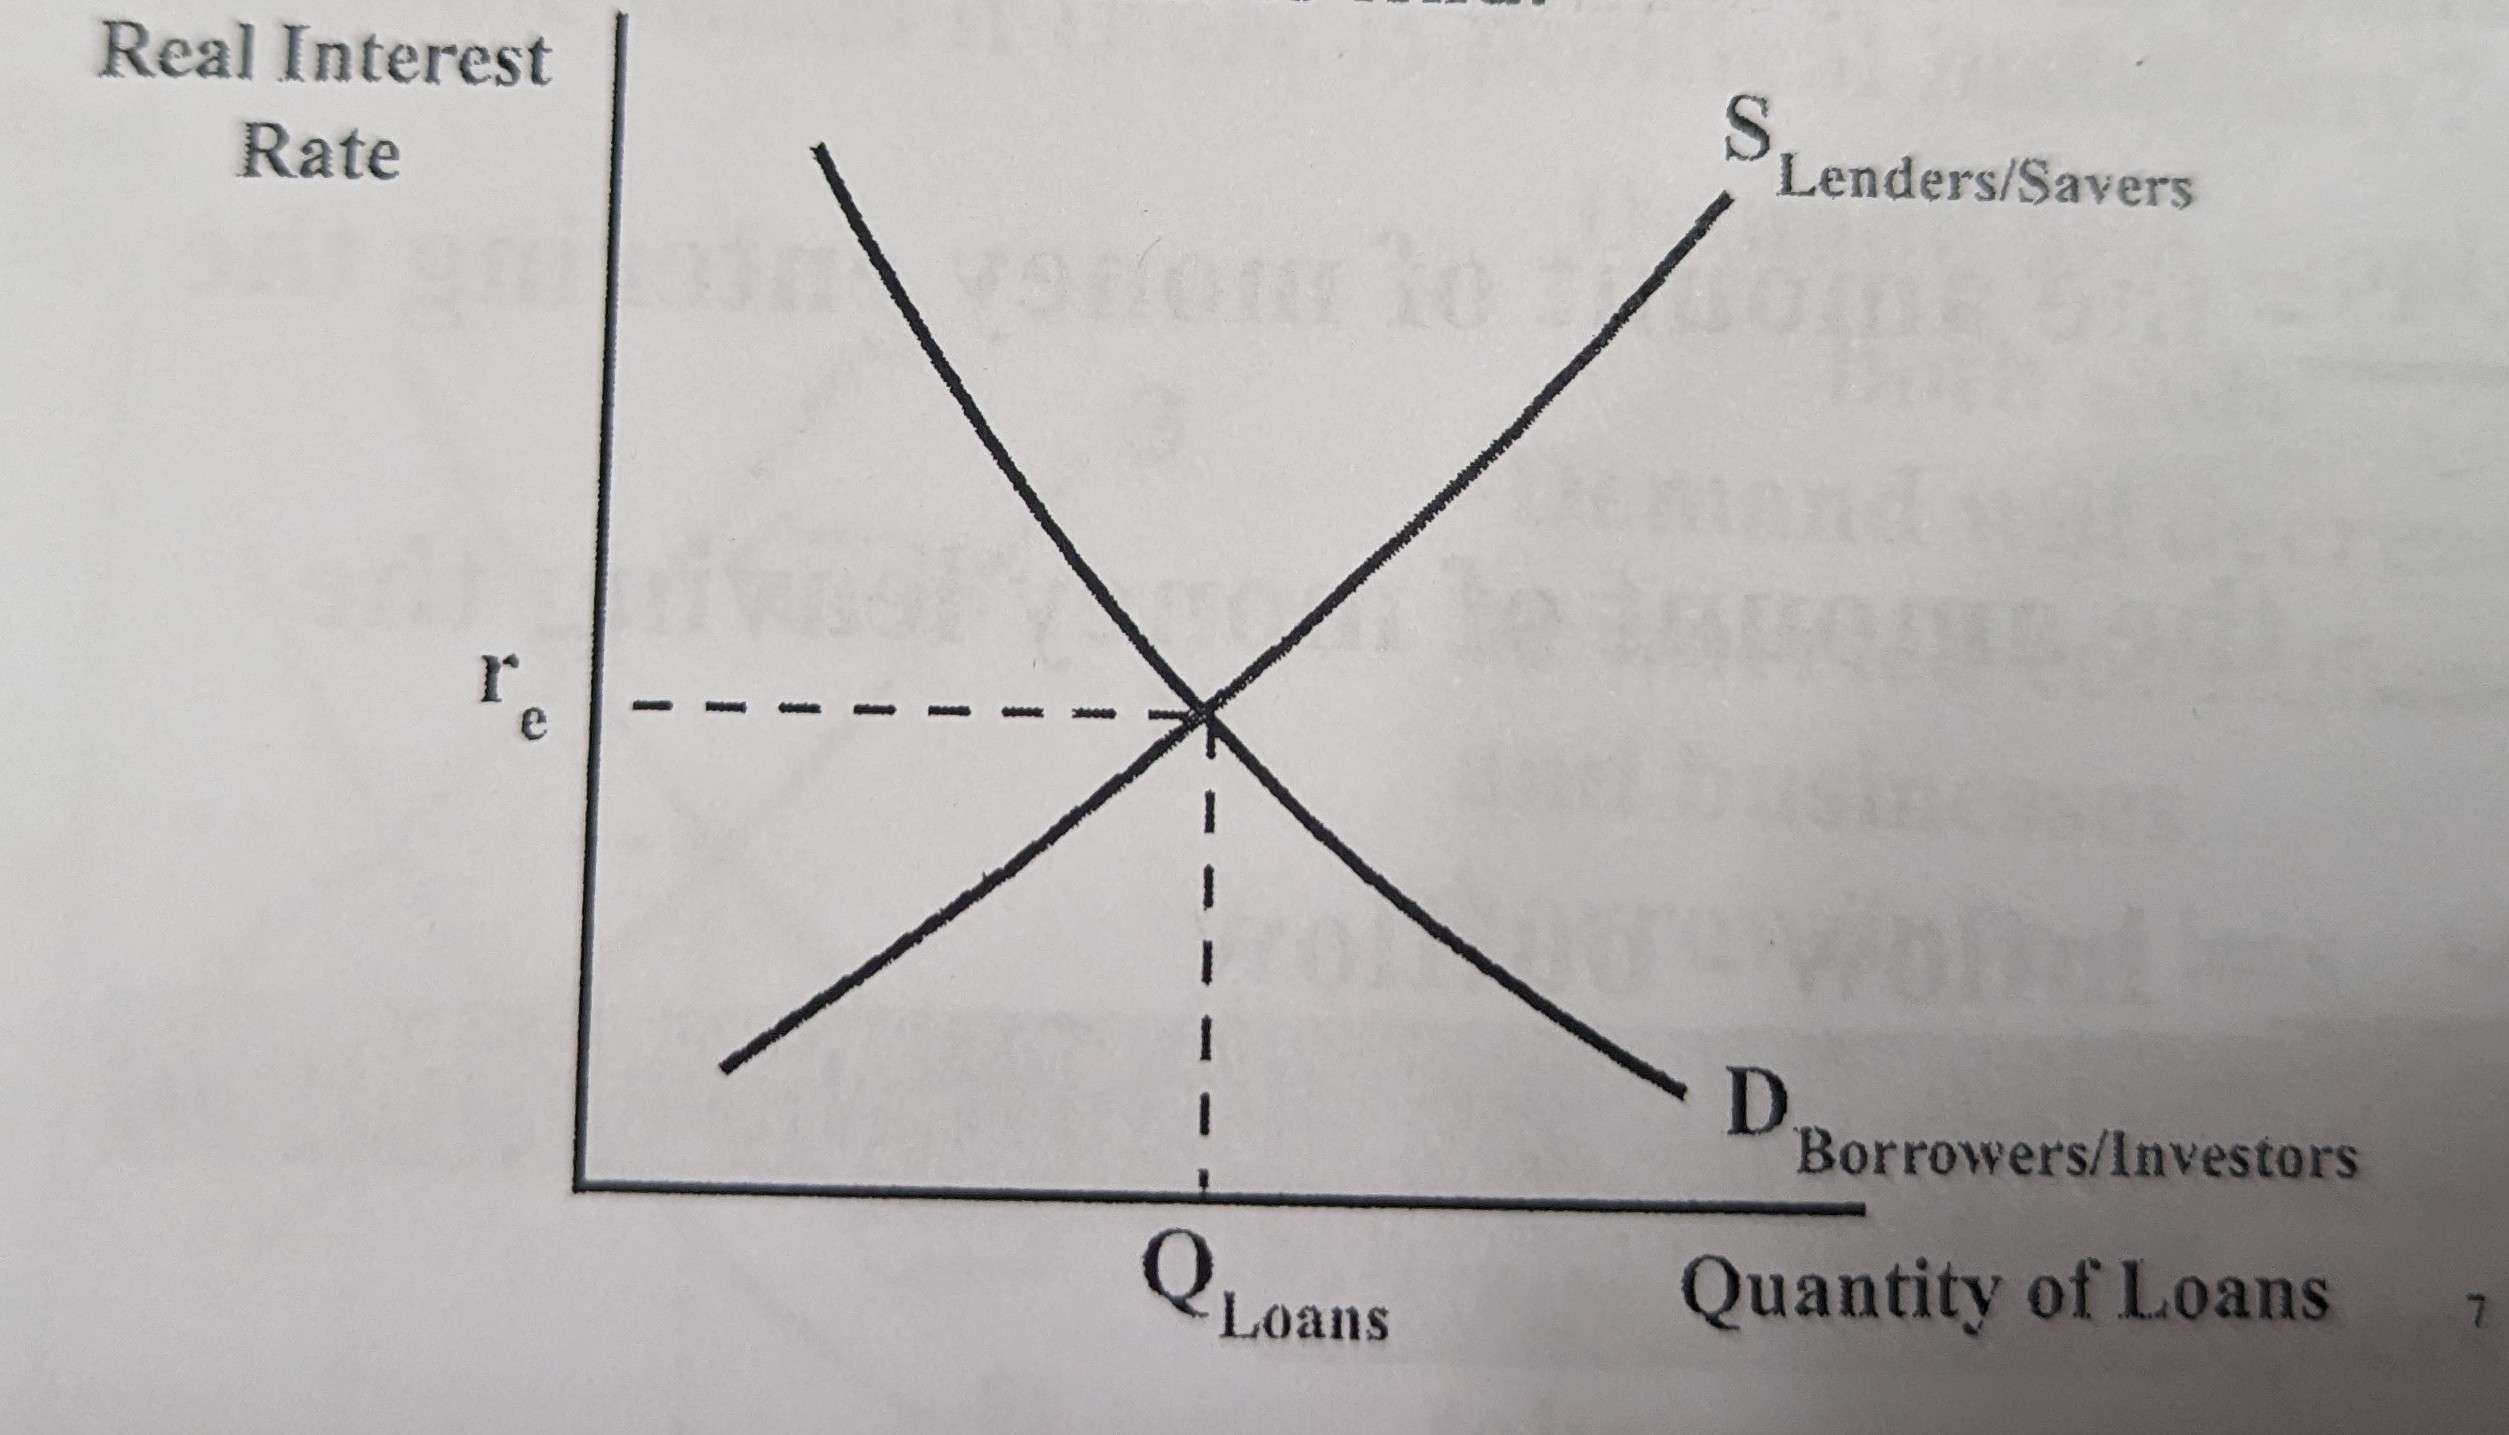
Loanable Funds Market Graph
Shows the supply and demand of loans and shows the equilibrium real interest rate
At the equilibrium real interest rate the amount borrowers want to borrow equals the amount lenders want to lend
There is an inverse relationship between real interest rate and quantity loans demanded
There is an direct relationship between real interest rate and quantity loans supplied
Private Saving (Loanable Funds Market)
The amount that households save instead of consume
Public Saving (Loanable Funds Market)
The amount that the government saves instead of spends
National Saving (Loanable Funds Market)
Public + Private savings
A change in public or private savings will shift the supply of loanable funds
Capital Inflow (Loanable Funds Market)
The amount of money entering the country
Capital Outflow (Loanable Funds Market)
The amount of money leaving the country
Net Capital Outflow (Loanable Funds Market)
Capital inflow - Capital outflow
A change in net capital inflow will shift the supply of loanable funds
Private Investment (Loanable Funds Market)
Borrowing by businesses and consumers
Government Bonding (Loanable Funds Market)
Deficit spending when government spending is greater than tax revenue
A change that affects borrowing will shift the demand of loanable funds
Loanable Funds Market Demand Shifters
Changes in borrowing by consumers
Changes in borrowing by businesses
Changs in borrowing by the government (ex: deficit spending)
Demand for loans comes from borrowers/investors
Loanable Funds Market Supply Shifters
Changes in private savings behavior
Changes in public savings
Changes in foreign investment (ex: more inflow of foreign financial capital)
Supply for loans comes from lenders/savers
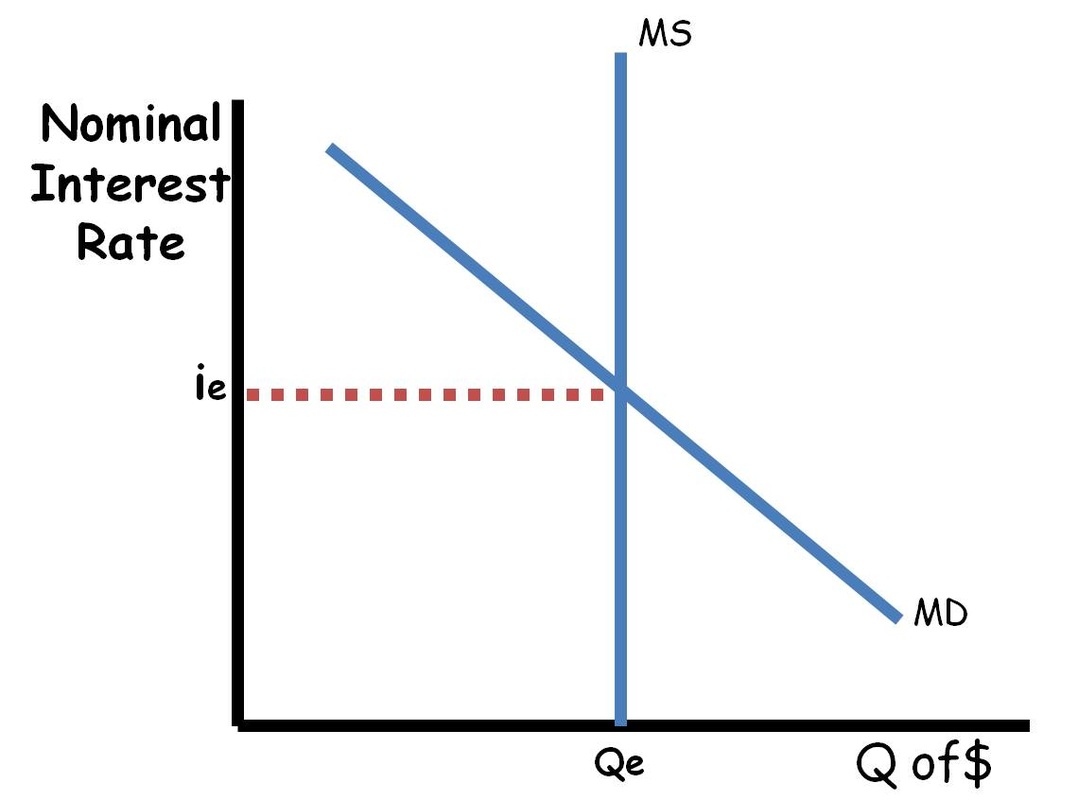
Why is the supply of money vertical?
The supply of money is controlled by the central bank and is unaffected by the interest rate
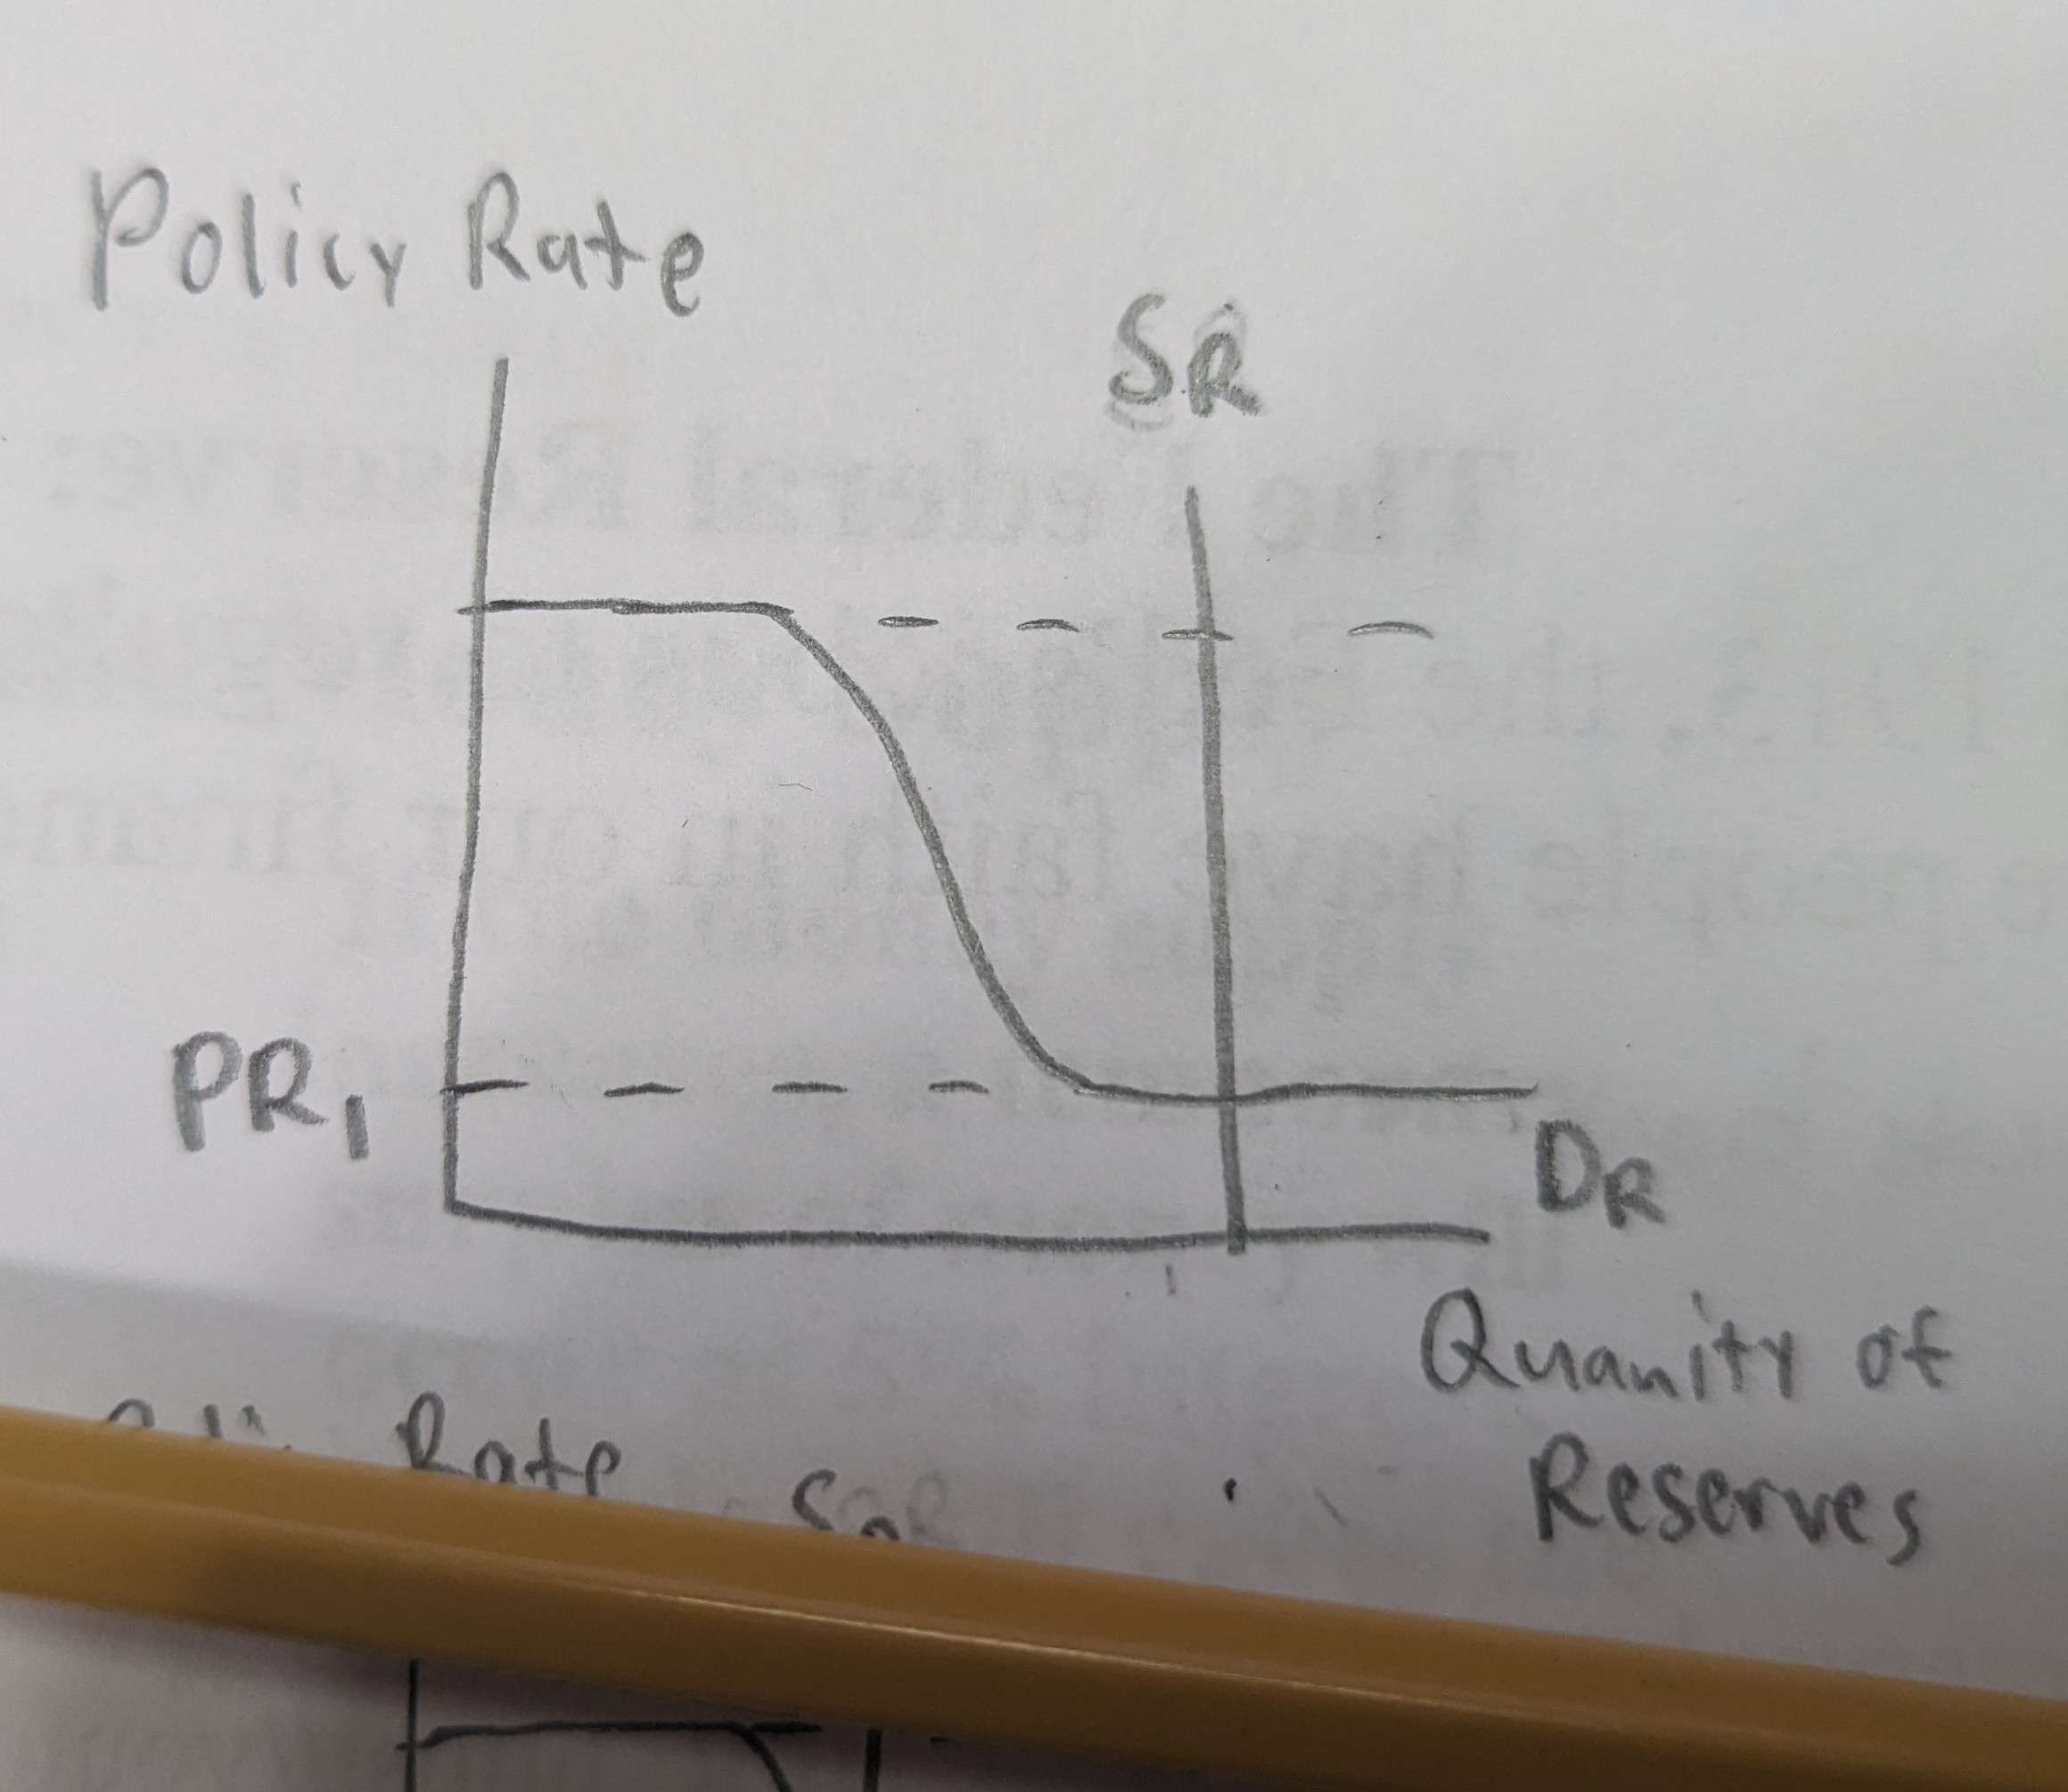
The Reserve Market Graph
This graph is mainly for banks with ample reserves, but it can also show banks with limited reserves too.
Banks with ample reserves are modeled by the reserve market graph and are not modeled with the money market graph.
The policy rate is the overnight interbank lending rate.
In the U.S. it is called the federal funds rate so sometimes instead of policy rate, the graph will say federal funds rate.
The dotted line at the top of the graph is the discount rate set by the central bank.
The discount rate puts a ceiling on the policy rate since banks could borrow at the discount rate from the central bank rather than other banks that may have higher rates
The dotted line at the bottom of the graph is the interest on reserves.
The IOR sets a floor for the policy rate as it is the rate the central bank is willing to pay commercial banks for reserves. Commercial banks wouldn’t lend money at a lower rate than the central bank to another bank.
The graph shown describes an ample reserves environment since the quantity supplied of reserves intersects the demand curve at the lower portion.
If the supply curve intersects the demand curve at the downwards-sloping portion or the upper portion, then the graph describes a limited reserves environment.
What is the relationship between the policy rate and the quantity of reserves demanded?
The policy rate has an inverse relationship with the quantity of reserves demanded.
Why is the supply of reserves vertical?
The supply of the reserves is vertical because it is set by the central bank and is not affected by interest rates.
The Money Market Graph
The money market graph depicts the inverse relationship between the nominal interest rate and money demanded.
When the money supply increases: Interest rates fall and investment rises
When the money supply decreases: Interest rates rise and investment decreases
The U.S. money supply is set by the FED and is independent of the interest rate.
Monetary Policy is the idea of controlling the money supply to affect interest rates in an economy.
The central bank controls the money supply through the shifts of money supply listed below.