


Ch 14 - Aggregate Demand
Aggregate demand: total spending on goods and services in a time period at a given price level. Made up of consumption, investment, government spending, and net expenditure
AD shows the relationship between average price level and real output. Shows the relationship between price level of output and total spending in the economy
AD = C + I + G + (X-M)
C: consumption, I: Investment, G: government, X-M: net exports - exports minus imports
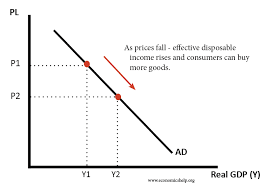
When prices fall, consumers purchase more confidently. More goods will be consumed at a lower price
Goods will become more expensive so demand for domestic goods will increase
Expectations: consumers expect prices to rise in the future they will increase their consumption if they expect prices to fall later
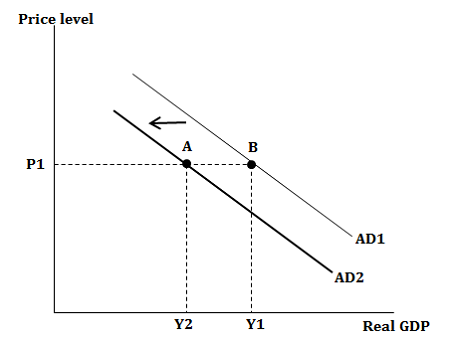
Any factor that changes aggregate demand will cause the AD curve to shift to the left or right
High unemployment = low inflation
Low unemployment = high inflation
Consumption is the total spending by consumers on domestic goods and services
More volatile and least sustainable
Changes in income: as income rises people have to spend more
Changes in interest rate: more incentive to save and consume less (borrowing increases, decrease in consumption)
Investment: firms investing into capital equipment machinery and premises
Rate of interest (amount firms pay to borrow money)
Business expectations: interest rates fall, consumers will have more disposable income
Accelerator effect: reaction of investment to the rate of change of income
Monetary policy:
A set of actions which achieve economic growth by controlling a nation’s overall money supply
Decrease in either AD will fall (growth will fall)
Increase in either AD will increase
Shifts of Aggregate demand:
A decrease in AD leads to a shift to the left on the demand curve, as an increase in AD causes a shift to the right on the demand curve
The theory behind wealth is that when price level decrease, real GDP increases. As money is being saved, it makes the household’s assets worth more, therefore increasing purchasing power
when households feel like they have saved money, they are more likely to purchase goods and services which benefits the economy.
If price level increases, GDP decreases as households tend to spend less on goods and services when there are supplementary goods. This leads to opportunity cost.
What causes a change in consumption?
Change in interest rates: Money borrowed from a bank will decrease in value as interest rates increase, leading to a decrease in consumption, which causes a fall (downward slope) in aggregate demand.
Changes in Income tax: When people have excess money to spend on goods and services, consumption increase. Whereas when income tax increases, disposable income of household decreases which leads to a decrease in consumption
Changes in wealth: Wealth is considered to be the value of assets which people own, unlike income which is the amount of money that people earn. Changes in wealth can be caused by a change in housing prices, which generates feeling of wealth and often causes people to spend more, save less, and borrow more. Also as the value of shares and stocks increase, consumers tend to spend more.
Level of Household indebtedness: Households are assumed to spend more and borrow more money from banks if interest rates were low and it became easy to borrow. This increases the spending on goods and services as well.
Government spending is the allocation of money to be spent on the public sector in order to ensure that the quality of goods and services is upkept. When a government promises to aid a firm in market failure, government spending increases. Any promises to upgrade public services will increase government spending.
If government spending increases, AD will shift to the right
If government spending decreases, AD will shift to the left