0.0(0)
AP Physics 1: Ultimate Guide (copy)
World History Midterm
Evaluating Learning Styles
PŻC tłuszcze -sprawozdanie
Theories of Personality: Alfred Adler
AP Computer Science A Ultimate Guide


BUS115 Midterm (Ch. 1-9)
Ch. 1 & 2- Marketing Research and Industry
- Marketing mix- Product, price, promotion, place (distribution)
- Marketing concept- more effective than competitors in creating, delivering, and communicating customer value.
- Cash cow- a single product that is consistently profitable
- Marketing research- designing, gathering, analyzing, reporting, and interpreting information that may be used to solve a specific marketing problem.
- Market research- define size, location, makeup of market for product/service
- Marketing research links- how the customer is going to be influenced by the marketing channel to make decisions.
- History of marketing research:
- Charles Coolidge Parlin- father of marketing research.
- 1930s was the start
- Alfred Politz- Statistical sampling
- Robert Merton- Focus groups 1940s
- Charles Coolidge Parlin- father of marketing research.
- Client-side research- market research done internally by a department or DIY using the internet and other resources.
- Supply-side research- companies with lots of capital can go to companies dedicated to marketing.
- Full-service supplier firms- do everything from defining problems, research design, collecting/analyzing data, and making the final report.
- Limited-service supplier firms- do only one or a few parts of the marketing service
- Ex: Online communities, questionnaires, data collection, data analysis, pretesting, market demographics (ex: senior citizens).
- Syndicated data services- published research about an industry available to companies at a subscription fee.
- Packaged services- proprietary process (secret and unique system) used for services like test marketing or measuring customer/employee satisfaction.
- Neilson is biggest marketing firm
- $44 billion revenue for marketing worldwide.
- Top 25 firms generate more than 50% of revenue, concentrated market.
Ch. 3- Marketing Research Process
11 steps of marketing research process:
- Need: Do we need marketing research?
- It’s expensive, so the value of research needs to be more than the cost.
- Problem: What’s the problem?
- Base it off of KPIs like decreases in sales, brand awareness, conversions, and or increases in returns and bad reviews.
- Check that the trends aren’t just industry based.
- Find opportunities.
- Objectives: What is the point of the research? What are we hoping to solve w the research?
- Design: How will we design the research?
- Exploratory
- Descriptive
- Causal
- What info is available?
- primary/secondary?
- How will we find data?
- How will we collect the data?
- Questionnaire- without bias
- Focus group- focus group guide
- Observe respondents- observation form
- What’s the sample?
- Sample plan- how samples will be drawn- should be defined by research objectives.
- Sample size- how many elements of population should be included. This determines if the results are representative of the population.
- How do we collect and validate data?
- 10% of respondents are randomly selected to be contacted and check that they took part in the survey.
- How do we analyze the data?
- Statistical tools like IBM or SPSS.
- How do we present the final research to the client?
- Use KPIs to determine the problem. Ex KPIs: decrease in brand awareness, website has fewer conversions, more complaints. All examples of a problem to recognize
- Research objectives- tell researchers exactly what information needs to be collected. Usually 3-6 objectives.
- Action standard- some insight that allows a manager to make a decision from a research objective.
- “If we research X, what needs to happen for us to use this research to make a decision?”
Ch. 4- Research Design
3 objectives of research design:
- Gain background info, hypotheses
- State of a variable (level of brand loyalty)
- Relationships between variables (level of brand loyalty and advertising)
Exploratory research
- Unstructured. broad, trying to feel out the industry.
- Methods of exploratory research:
- Secondary data analysis
- Experience surveys: Key informant / Lead-user surveys
- Case analysis
- Focus groups
- Methods of exploratory research:
Descriptive research
- Examines characteristics of consumers/markets. Who, what, where, when, how.
- Methods:
- Cross-sectional studies: a snapshot of population through sample surveys
- Longitudinal studies: repeatedly measure same people over time. Movies of the population. Panels: respondents who have agreed to answer questions at regular intervals.
- Continuous panels: same questions each time to measure changes in consumers’ attitudes and behaviors over time.
- Ex: brand switching, market-tracking
- Discontinuous/omnibus panels: different questions. Helpful to have consumers that can be quickly accessed for different purposes.
- Continuous panels: same questions each time to measure changes in consumers’ attitudes and behaviors over time.
- Methods:
- Causal research: “If x, then y.” Uses experiment with independent, dependent, and extraneous variables.
- Control group- control of extraneous variables
- Experimental group- group that has been exposed to a different independent variable.
- Before-after testing: design where dependent variable is measured before and after independent variable is changed. Other tests:
- Pretest; posttest
- A/B testing- 2 alternatives simultaneously tested to see which performs better.
- Experiments can be internally (actually due to changing independent variable) or externally valid (when relationship between variables can be generalized to the real world).
- Laboratory experiments- artificial setting. Meant to control extraneous variables. quicker/less expensive. Not generalizable.
- Field experiments- natural setting, independent variables manipulated. Externally valid. expensive/time consuming. Many extraneous variables.
- Test marketing- a kind of field experiment.
- Tests sales potential and variation in marketing mix
- Standard test market- firm tests product/marketing mix through normal distribution channels. Pro: Externally valid. Con: competitors are aware of new products.
- Ex: A clothing brand releases its new line in multiple cities simultaneously to gauge overall market response before a nationwide rollout.
- Controlled test markets- supply side research with specific distribution methods.
- Ex: A tech company tests its app in three cities with different ad strategies to refine its national launch plan.
- Simulated test markets- data on consumer response to a new product is fed into a model containing certain assumptions regarding planned marketing programs, which generates likely product sales volume. Competition won’t see. Not as externally valid.
Ch. 5- Secondary Data & Packaged Info
- Big Data- Lots of data from multiple sources. We generate 2.5 quintillion bytes of data daily.
- Primary data- developed by researchers for a specific project.
- Secondary data- previously gathered data for another purpose outside of the company that can be applied in current context.
- Internal secondary data- data that has been accumulated within the firm and is used in database marketing.
- Internal databases help direct marketing and strengthen relationships with customers, called CRM.
- Data mining- making sense out of lots of data.
- Micromarketing- differentiated marketing mix strategy for specific customer segments.
- External databases- databases supplied by outside firm organizations.
- 1. Published sources- publicly distributed by specialists.
- Business journals
- Magazines
- Newspapers
- Academic journals
- 2. Official statistics- public, government, international organizations.
- Ex: WHO, OECD, World Bank, IMF
- Open data policy 2013- government data is open by default. data.gov= 200,000 datasets from 170 organizations.
- 3. Data aggregators- vendors package information on focused topics.
- Ex: IBISWorld, Statista, ProQuest.
- 4. Syndicated services data- firms that collect highly specialized data, not available in libraries, and share them with subscribing firms.
- 1. Published sources- publicly distributed by specialists.
- Pros and Cons of Secondary Data:
- Pros:
- Quick
- Inexpensive (compared to making your own)
- Readily available
- Can be used to enhance primary data by providing a benchmark and context.
- Helps research objective.
- Cons:
- Reporting units don’t match- ex:not same location.
- Measurement units don’t match- ex: currency doesn’t match
- Definitions of characteristics can vary slightly.
- Outdated info or not credible.
- Pros:
- Packaged information:
- Syndicated- premade by a firm from a common database, available at a service fee.
- Pro:
- Shared costs
- Faster
- High quality data.
- Con:
- Buyers don’t have much control over the data that’s collected.
- Must commit to long-term contracts.
- Competitors have access to same info.
- Pro:
- Packaged services- premade marketing research from different data sources tailored for clients.
- Pro:
- Experienced research firm
- Reduced cost
- Speed
- Con:
- Can’t customize all aspects.
- Research company might not have much knowledge of client’s industry.
- Uses:
- Can be used for measuring customer attitudes
- Identifying segments and geodemographics
- Monitoring promotion effectiveness
- Tracking sales.
- Pro:
- Syndicated- premade by a firm from a common database, available at a service fee.
- Digital tracking data terms you should know:
- Point of sale (POS)- data automatically collected when consumers buy products
- Cookie- stores users browsing data
- Device ID- identifier for a mobile device
- Geolocation data- identifies physical location of device
- Social media data/user generated content (UGC)- info created by users of online systems and shared.
- Ex: reviews, tips, new users, competitors.
- Sentiment- ratio of positive to negative comments posted about product/brand on web.
Ch. 6- Quality Research Techniques
- Quantitative research- (what) structured questions and predetermined response options with a large population of respondents. Specific purpose and clear, well defined numerical data format/sources.
- Qualitative research- (why) collecting, analyzing, interpreting data by observing what people do and say. Non standardized, open ended, consumer behavior. Thick data = important tie w big data.
- Mixed method research- both quantitative and qualitative. Can have 3 types:
- Qualitative before quantitative
- Quantitative before qualitative
- Qualitative and quantitative concurrently
- Types of observation methods:
- Direct vs. Indirect
- Direct- observe behavior as happens
- Indirect- observe effects of behavior from archives of secondary sources like historical records or from physical traces like tangible evidence of past events.
- Overt vs. Covert
- Overt- respondent knows.
- Covert- subject doesn’t know they are being observed.
- Structured vs. Unstructured
- Structured- researcher identifies beforehand which behaviors are to be observed/recorded with a checklist and all other behaviors are ignored.
- Unstructured- all behavior is observed and observer determines what should be recorded based on what’s relevant.
- In situ vs. Invented
- In situ- Researcher observes behavior exactly as it happens
- Invented- researcher creates simulated situations and watches what happens.
- Observation must be in short time intervals, be public behavior, and behavior that is automatic (“faulty recall conditions”- person can’t even realize they do them).
- Direct vs. Indirect
- Focus groups- small groups brought together and guided by moderator in unstructured spontaneous discussion to gain relevant info for research problem.
- Typically 6-12 people meet in a room with a 1-way mirror for client viewing.
- Should be used when the objective is to describe rather than predict.
- Should not be used when research question requires prediction or major decision.
- Objectives:
- Ideas, understand consumer vocab, reveal consumer perceptions/motives, understand quantitative findings correlation.
- Pros:
- New ideas, client can observe, understand lots of issue, easy to access.
- Cons:
- Not representative, dependent on moderator, difficult to interpret.
- Considerations for designing a focus group:
- # of people
- Who
- How many focus groups
- How recruited
- Where to meet
- When should moderator get involved
- How reported
- Benefits of focus group
- Moderators have to have great interpersonal, communication, and observational skills. They also encourage everyone to participate and are involved, energetic, and prepared.
- Focus group report summarizes info into:
- 1. Categories of statements and the apparent consensus in the group.
- 2. Demographic/buyer behavior characteristics compared to target market profile to understand how much the group represents the target market.
- Ethnographic research- detailed, comprehensive descriptive study of a group/consumers and their behavior, characteristics, culture, etc., over prolonged periods.
- Effective for studying trends, habits, lifestyle, social/cultural context on consumption.
- Close attention to words, metaphors, symbols, stories people use to explain lives and communicate.
- Shopalongs- researcher accompanies a shopper with permission to observe and record shoper’s activities.
- Mobile ethnography- respondents document their experiences through mobile phones.
- Netnography- online interactions of individuals/communities on Internet and relationship people have with their electronics.
- In-depth interviews (IDI)- probing questions, 1:1. What subject thinks about something, why they behave certain way.
- Laddering- how attributes are associated with consumer values.
- Protocol analysis- placing person in decision-making situation and asking them to verbalize everything they consider when making a decision.
- Projective techniques- participant projected into simulated activities in hopes they will divulge personal information that they wouldn’t normally say when directly questioned.
- 5 types of projective techniques:
- Word-association test- first word that comes to mind.
- Sentence completion test- finish the sentence.
- Picture test- write a short story about picture to describe reactions
- Cartoon/balloon test- given a cartoon strip with characters and an empty speech/thought bubble and respondents fill it in.
- Role-playing- how would they react as a 3rd person to a certain situation or specific statement.
- 5 types of projective techniques:
- Neuromarketing- involuntary responses to marketing stimuli such as eye movement, heart rate, skin conductance, breathing, brain activity.
- Neuroimaging- viewing brain activity- unconscious emotions.
- Eye tracking- measuring eye positions and movement.
- Facial coding- measure universal expressions of emotions by appearance on faces.
- Thematic analysis- examining qualitative data to find themes/patterns related to research objectives.
- Theme- pattern found across data that relates to objective
- Substantiating example- example that provides evidence for the theme.
- Verbatim- quote from participant used as substantiating example.
Ch. 7- Evaluating Survey Data Collection Methods
- 6 advantages of surveys:
- 1. Standardization
- 2. Lots of info quickly
- 3. Easy to do
- 4. Gets “beneath the surface”
- 5. Easy to analyze
- 6. Shows differences in subgroups
- Pick method by considering: speed, cost, and quality.
Data Collection Methods
- Interviewer (Person-administered vs. Computer-assisted) vs. No Interviewer (Self-administered (can be group self-administered or drop-off as well) vs. Computer-administered)
- Main difference between interviewer and none is that with an interviewer the interviewer reads the questions and records the answers.
- In-Home Surveys- useful when the respondent needs to physically interact with the research object, product, or prototype.
- Pros: Creates privacy, ensures authenticity and quality
- Cons: High cost, longer to recruit and travel.
- Mall-intercept survey- respondents found/questioned at shopping mall.
- Pros: Less expensive than in-home.
- Cons: Not a representative sample, people may feel uncomfortable answering at mall, frequent shoppers have higher chance of being interviewed.
- In-Office Surveys- in-person while respondent is in the company area.
- Pros: Useful for interviewing busy executives. Face-to-face gives feel of in-home.
- Cons: High cost per interview, difficult access.
- Telephone Surveys-
- Pros: Reasonable cost, quality control, fast turnaround
- Cons: Respondents can't physically interact, doesn’t tell body language, limited type and # of info obtainable, increasing noncooperation (people not picking up).
- Central location telephone surveying- field data collection company sets up many phone lines at one location where the interviewer can make calls.
- Pros: Efficient quality control, monitored interview process, established interview schedule.
- Cons: same as telephone surveys.
- Computer-Assisted Telephone Interviews (CATI)- like central location telephone surveying, but CATI software has built-in logic so questions asked are tailored to respondents’ prior answers and inappropriate answers are disallowed.
- Mail survey- cons: nonresponse (not returning it), and self-selection bias (those who respond are probable different from those who don’t).
- Panel company- respondents are recruited for compensation by an institution.
- Pro: fast, high quality, info available in database, targeted respondents, integrated features.
- Cons: not random samples, overused respondents, cost
Ch. 8- Understanding Measurement, Developing Questions, and Designing the Questionnaire
- How measurement works:
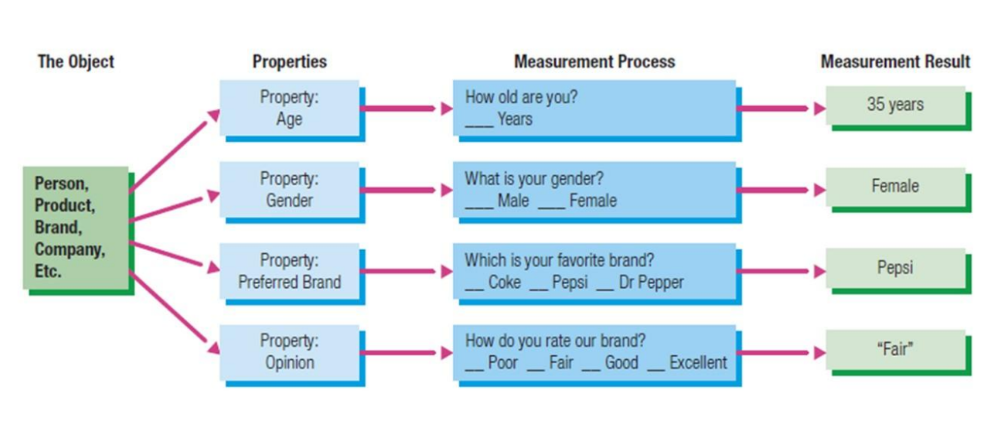
- 3 Types of measures-
- Nominal- data that fits categories. Ex: religion, gender, buyer/non buyer, preferred brand.

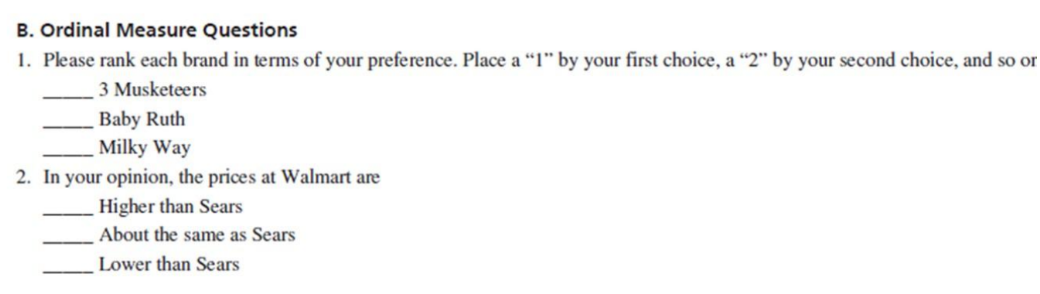
- Ordinal- data that can be ranked or ordered. Ex: Education level (primary, secondary, post-secondary), Income (low, middle, high), Overall status (poor to excellent).
- Scale measures- distance between each level is known.
- 2 Types of Scale Measures:
- A. Interval scales- typically continuous data with distance of 1 scale unit. Ex: level of enjoyment, level of agreement, level of customer service.
- 1. Likert scale- level of agree/disagree. Use flat/plain statements.

- Lifestyle inventory- measures a person’s activities, interests, and opinions with Likert scale.
- 1. Likert scale- level of agree/disagree. Use flat/plain statements.
- A. Interval scales- typically continuous data with distance of 1 scale unit. Ex: level of enjoyment, level of agreement, level of customer service.
Ex: “I shop a lot for specials,” or “I prefer to pay with a debit card.”
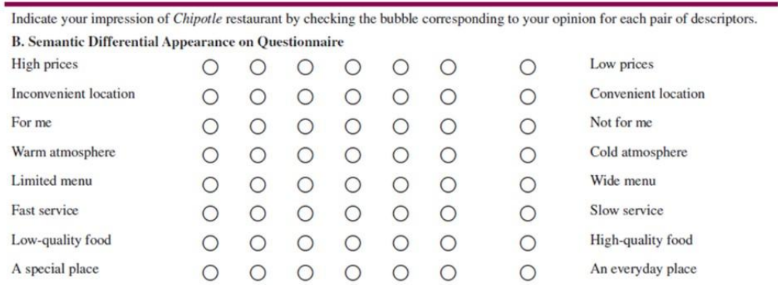
- 2. Semantic differential scale- shows opposite words on each side of scale and respondent picks what side the lean towards more.
- Good for measuring brand, company, store image.
- Halo effect- where general feeling/bias about brand or store affects responses on specific properties.
- 3. Stapel scale- positive and negative numbers, typically 5 to -5, sometimes with neutral zero.
- 4. Slider scale-
- 2. Semantic differential scale- shows opposite words on each side of scale and respondent picks what side the lean towards more.
- 2 issues with interval scales:
- 1. Should there be a middle/neutral point?
- 2. Should it be symmetrical or non-symmetrical?
- Symmetrical- equal positive and negative options, typically has middle point.
- Non-symmetric- mainly positive positions. Most slider scales use nonsymmetric and have 1 as lowest point.
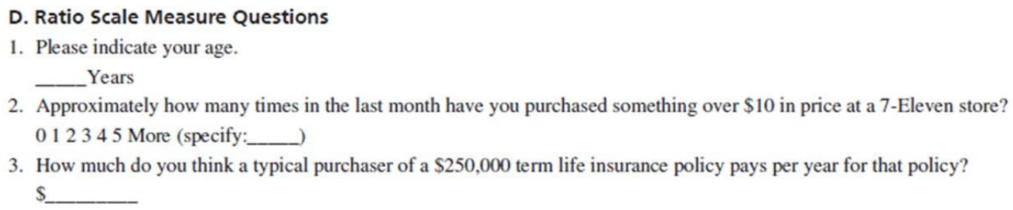
- B. Ratio scales- have a true zero point with actual #s. Ex: # of purchases in a time period, $ spent, miles traveled, # of children, years of college education.
- Measurement is reliable if respondents answers same/similar to similar measures (questions). Measurement is valid if there is accuracy or exactness of measure or answer.
- Question development and questionnaire design process:
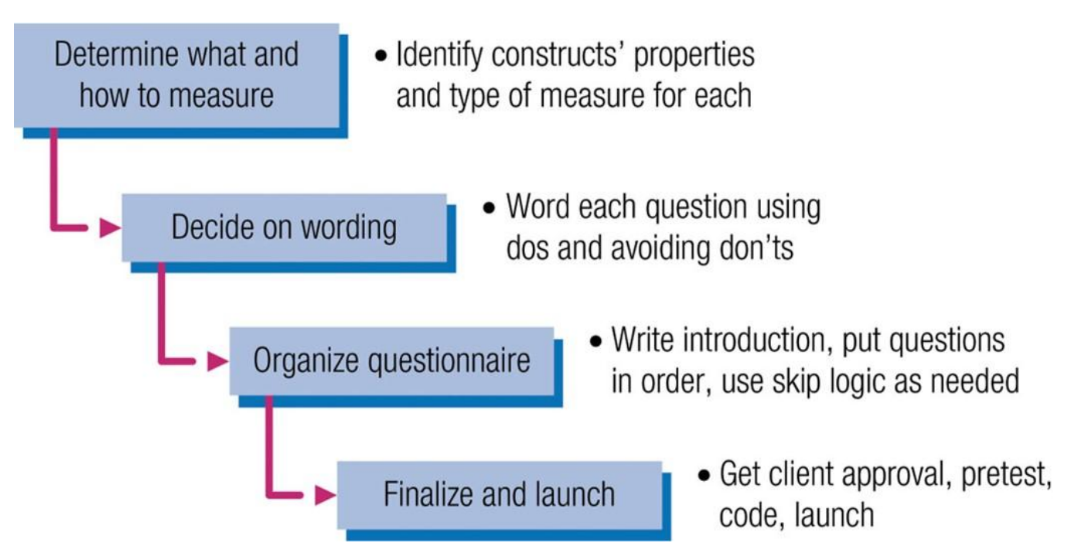
- Question development- choosing format and wording so it's understandable and unbiased.
- Question evaluation- scrutinizing wording, minimize bias
- 4 Do’s of Question Wording:
- 1. Focused on 1 issue/topic
- 2. Brief
- 3. Grammatically simple
- 4. Crystal clear
- 4 Don'ts of Question Wording:
- 1. “Lead” respondent to particular answer.
- Ex: “Don’t you worry when using your credit card for online purchases?” Instead, “Do you have concerns when using your credit card for online purchases?”
- 2. Use “Loaded” wording/phrasing.
- Ex: “Should people be allowed to protect themselves from harm by
- using a Taser in self-defense?” Instead, “Do you think carrying a Taser for personal safety is acceptable?”
- 3. Use “double-barreled” question. 2 questions mushed into one.
- Ex: “Were you satisfied with the restaurant’s food and service?”
- 4. Using dramatic words to overstate case.
- Ex: “How much do you think you would pay for a pair of sunglasses that will protect your eyes from the sun’s harmful ultraviolet rays, which are known to cause blindness?” Instead, “How much would you pay for sunglasses that will protect your eyes from the sun’s glare?
- 1. “Lead” respondent to particular answer.
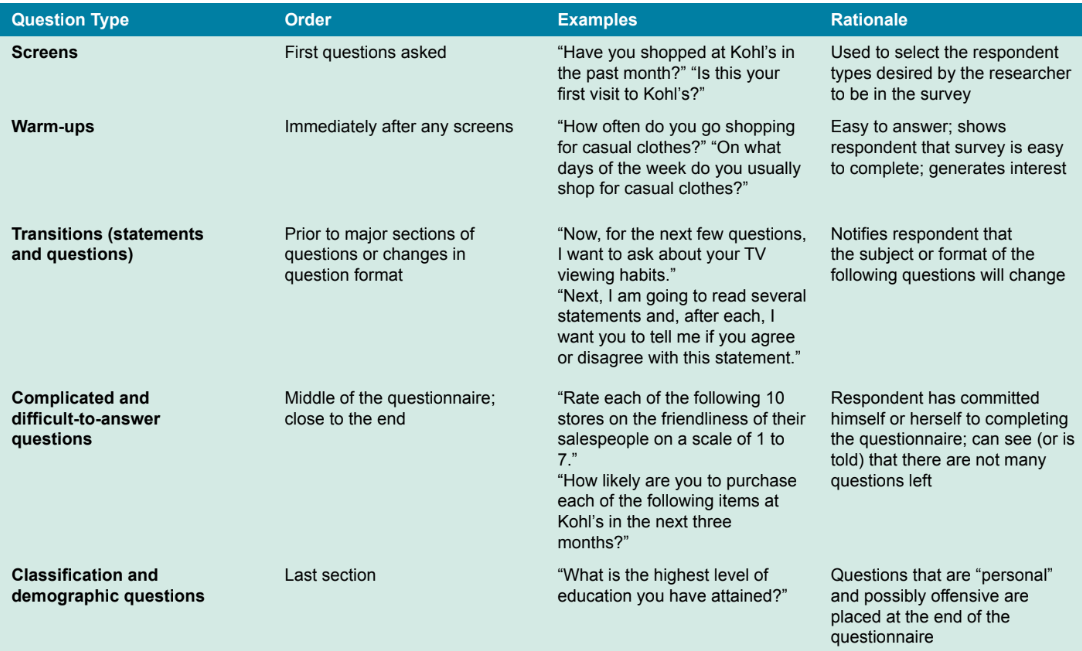
- Questionnaire Order:
- Introduction- Start with incentives, ensuring anonymity and or confidentiality.
- 1. Screening questions- identify respondents who do/do not meet qualifications for research study.
- 2. Warm-up questions- simple, easy-to-answer to gauge respondents’ interest and show respondent how easy survey is.
- 3. Transitions- statements or questions that signal a change of topic in questionnaire.
- 4. Complicated questions go in middle, deep in questionnaire.
- 5. Classification questions- typically demographics to classify respondents.
- Computer assisted questionnaire design can use logic to display questions:
- Skip logic- changes questions based on prior responses.
- Display logic- changes questions, answers choices, images, etc. based on predefined conditions and answers.
Ch.9- Selecting the Sample
- Population- all of the respondents in the study.
- Census- accounting or complete population.
- Sample- small subset of the population, should be representative of whole population.
- Sample unit- whatever level of investigation that you have defined
- Sample frame- master source of sample units in the population
- Sample frame error- the amount that the sample frame fails to account for the whole population.
- Sampling error- when survey has error because of the sample used.

Types of Sampling Methods:
- Probability sampling methods- when there is a known probability that X number of members in the population will be chosen for the sample.
- Simple random sample- everyone has an equal chance to be selected.
- Probability of being selected = sample size/population size. You have to label each member of the population with a code to pick.
- Method of picking random:
- Random device method
- Blind draw/random number
- Random digit dialing (RDD)

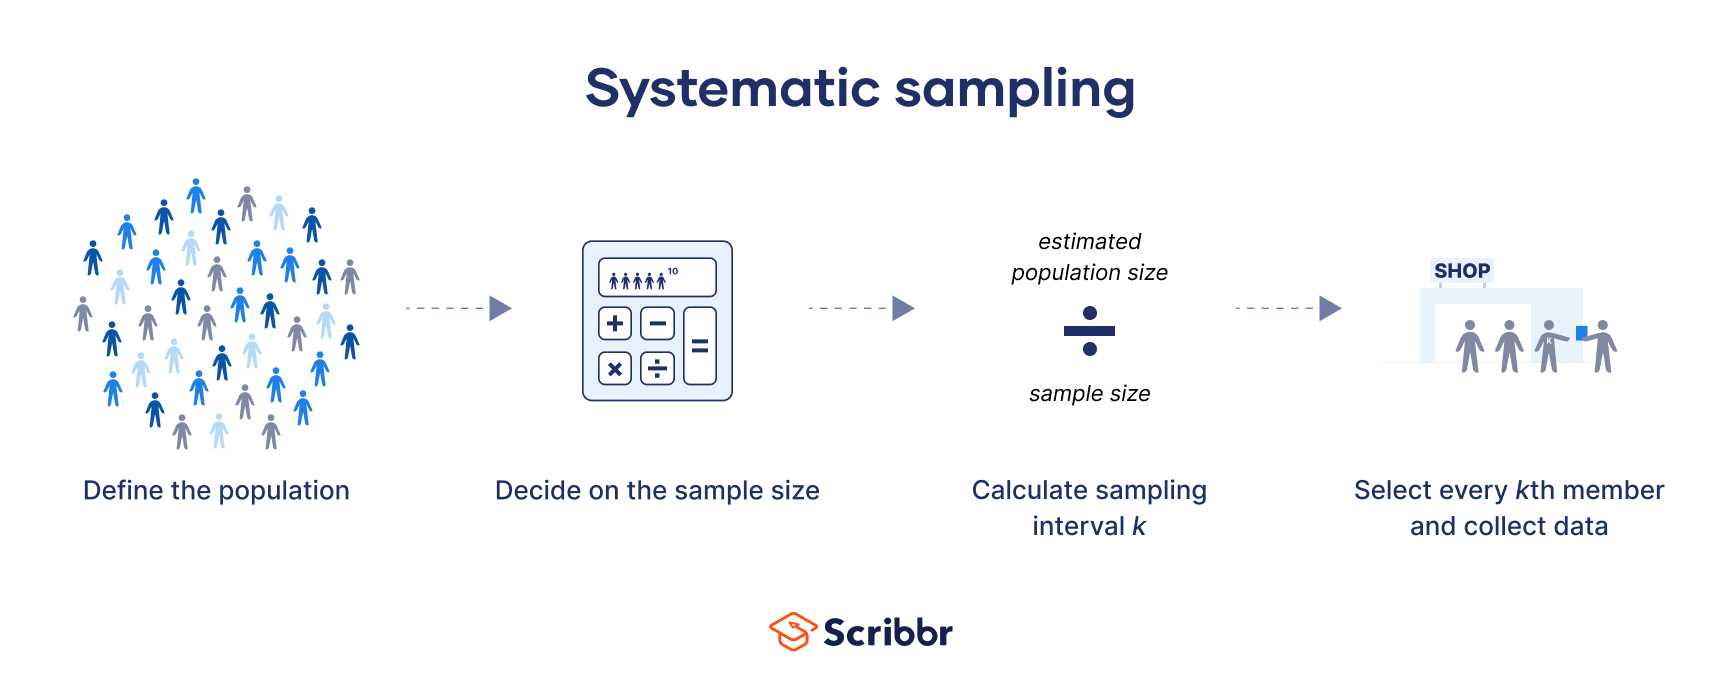
- Systematic sampling- using a skip interval. More efficient than simple random.
- Skip interval = population list size/sample size
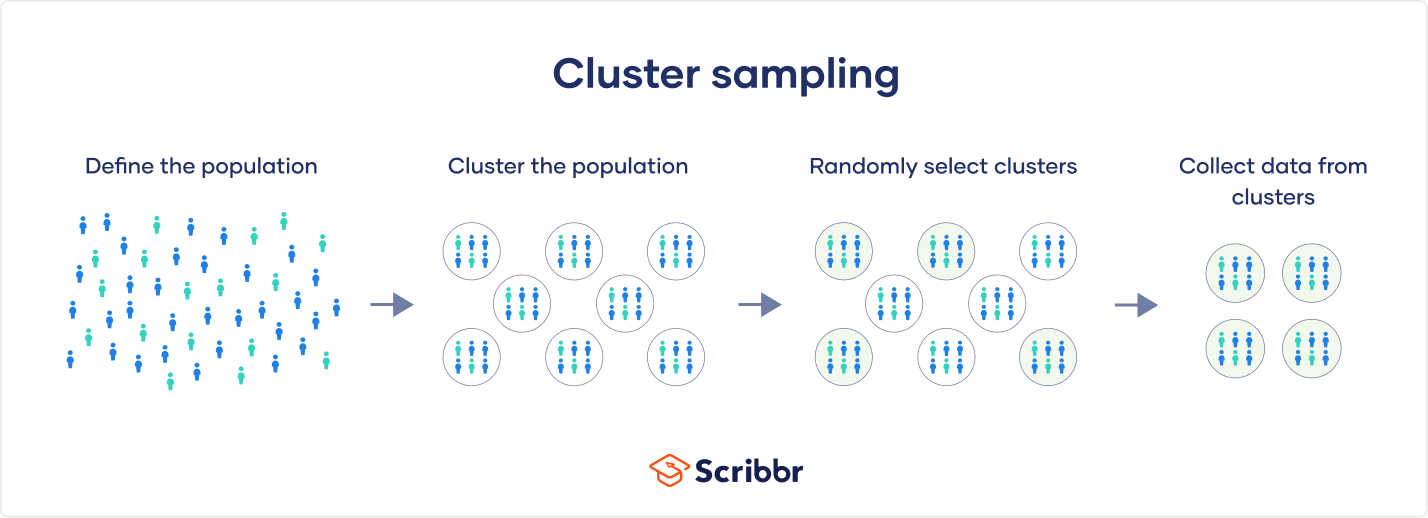
- Cluster sampling- when you cluster members within the population which are representative of the whole.
- Groups are similar to each other.
- Area sampling- when a geographic area is divided into clusters
- One-Step Area sampling- if the areas are identical enough, then researcher can focus on studying one area and generalizing the results for the full population.
- Two-Step Area sampling- 1. Researcher selects a random sample of areas 2. Picks a probability method to sample individuals within those areas.
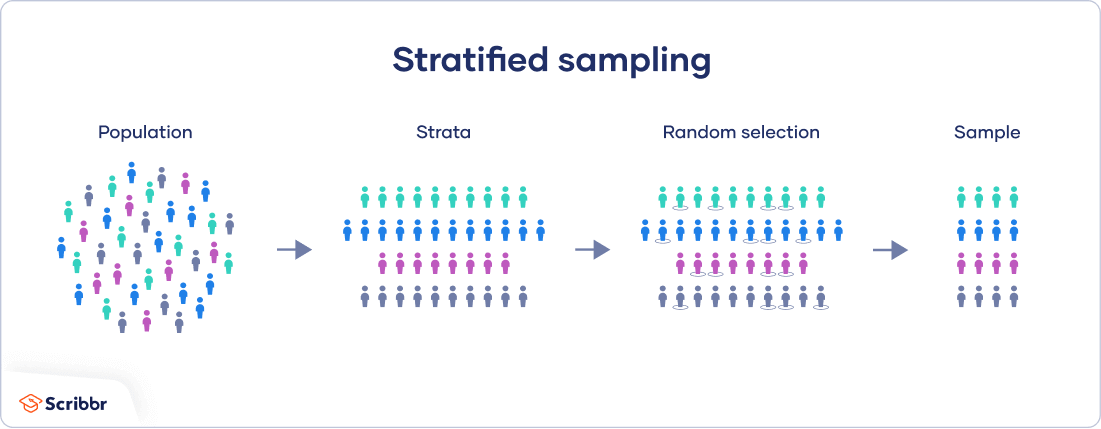
- Stratified sampling- separates population into subgroups and samples each subgroup.
- May require calculation of weighted mean. Helpful when working with a skewed population. Proportionate stratified sample ensures sample size is scaled to population size.
- Non-probability sampling- sometimes known as haphazard sampling because probability of selection in sample is unknown and often prone to human error and subconscious bias.
- Convenience sampling- areas with high traffic (like mall interviews)
- Might not be representative of the actual sample.
- Chain referral samples- respondents refer others to respond to the survey.
- Purposive samples- educated guess as to who should represent those.
- Quota samples- identified quota of characteristics that are desired in the sample. Choose certain demographics to target so you can meet the quota of respondents in that group. Often tied with convenience sampling.
- Online sampling techniques:
- Online panels- lots of ppl who have agreed to participate in online surveys.
- River samples- banners, pop-ups that invite respondents to take part in survey.
- Email list samples- purchased/procudred from someone or company that has emails which have opted-in and are identified as populations of interest.
- 6 Steps in sample plan:
- Define the population
- Obtain a sample frame
- Decide on the sample method
- Decide the sample size
- Draw the sample
- Validate the sample