What are externalities?
special type of “good” and “bad”.
Externalities are third party effects arising from production and consumption of goods and services for which no appropriate compensation is paid.
Where do externalities occur?
outside of the market ie. they affect people not directly involved in the production and/or consumption of a good or service.
(No-one goes looking for noise, pollution, or even the positive externalities.)
They are also known as spill-over effects.
What’s an example of a negative externality of consumption?
A person smoking a cigarette (or eating an egg sandwich) at a bus stop has made a deliberate economic decision to consume a product.
The person standing next to her has not made that decision but is ‘consuming’ the bad smell resulting from the decision made by the other person.
What’s an example of a positive externality of consumption?
A family halfway down my street love their fireworks!
They spend a huge amount on sophisticated fireworks on Guy Fawkes night and put on a great display.
Assuming I enjoy fireworks, their economic decision to consume fireworks counts as a positive externality of consumption for me
Externalities can be….
Subjective
What’s an example of a negative externality of production?
Making furniture by cutting down rainforests in the Amazon displaces the indigenous people of the Amazon rainforest.
It also leads to higher global warming as there are less trees to absorb carbon dioxide
What’s a positive externality of production?
A farmer grows apple trees. An external benefit is that he provides nectar for a nearby beekeeper who gains increased honey because of the farmers orchard
What are socials costs?
include both the private costs and any other external costs to society arising from the production of a good or service.
Social cost = Private cost + External cost
What are private costs?
include the costs the firm pays to purchase capital equipment, hire labour, and buy materials or other inputs, for a producer of a good, service, or activity
Private costs are paid by the firm and must be included in production decisions.
What are external costs?
not reflected on firms’ income statements.
However, external costs remain costs to society, regardless of who pays for them.
If social benefit > social cost, then…
product/project is good for society at large.
if private benefit ≯ private cost then…
it will not be worthwhile for an entrepreneur/firm to invest.
What do negative production externalities lead to?
• under-pricing
• over-consumption
• over-production of goods (Excess Supply)
What do Positive production externalities lead to?
over-pricing
under-consumption
under-production (Excess Demand)
What are Negative production externalities & Positive production externalities examples of?
market failure: the market mechanism producing the goods in the wrong quantities.
What are negative externalities in production?
costs resulting from the production process that aren’t paid for by the producer.
What determines the supply curve?
costs of production
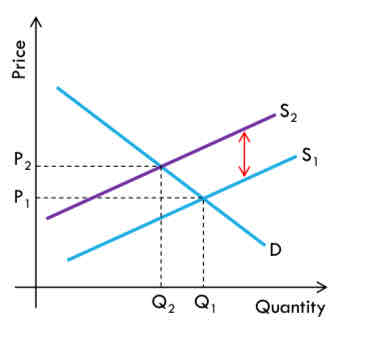
Negative Production Externalities Diagram
Without having to pay for externalities, the supply curve is at S1. This is called the private supply curve. It leads to a private equilibrium at (Q1, P1).
Supply curve S2 is the social supply curve. It factors in the external costs and leads to a social equilibrium at (Q2, P2). Notice that price is higher, and quantity is less
vertical gap between the two supply curves represents the external costs.
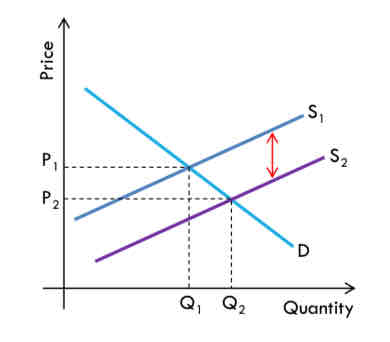
Positive Production Externalities Diagram
Without gaining the benefit of the externalities, the supply curve is at S1. This is called the private supply curve. It leads to a private equilibrium at (Q1, P1).
A social equilibrium at (Q2, P2) including external benefits, could be achieved, for instance, by government subsidies to incentivise greater production
This time the vertical gap between the two supply curves represents the external benefit. Positive Production Externalities P2 Q2
Why do positive production externalities lead to market failure also?
producers may under-supply, knowing that they do not reap all the benefits of production
Why does the market fail and what is done to correct this?
The market (left to its own devices) fails, because the socially irresponsible private equilibrium will be the outcome.
The government can intervene to ‘correct’ the market. It could, for instance, introduce a pollution tax, forcing companies to pay costs equal to the estimated* value of the negative externalities.
This effectively shifts the supply curve back to S2 leading the market to find the social equilibrium.
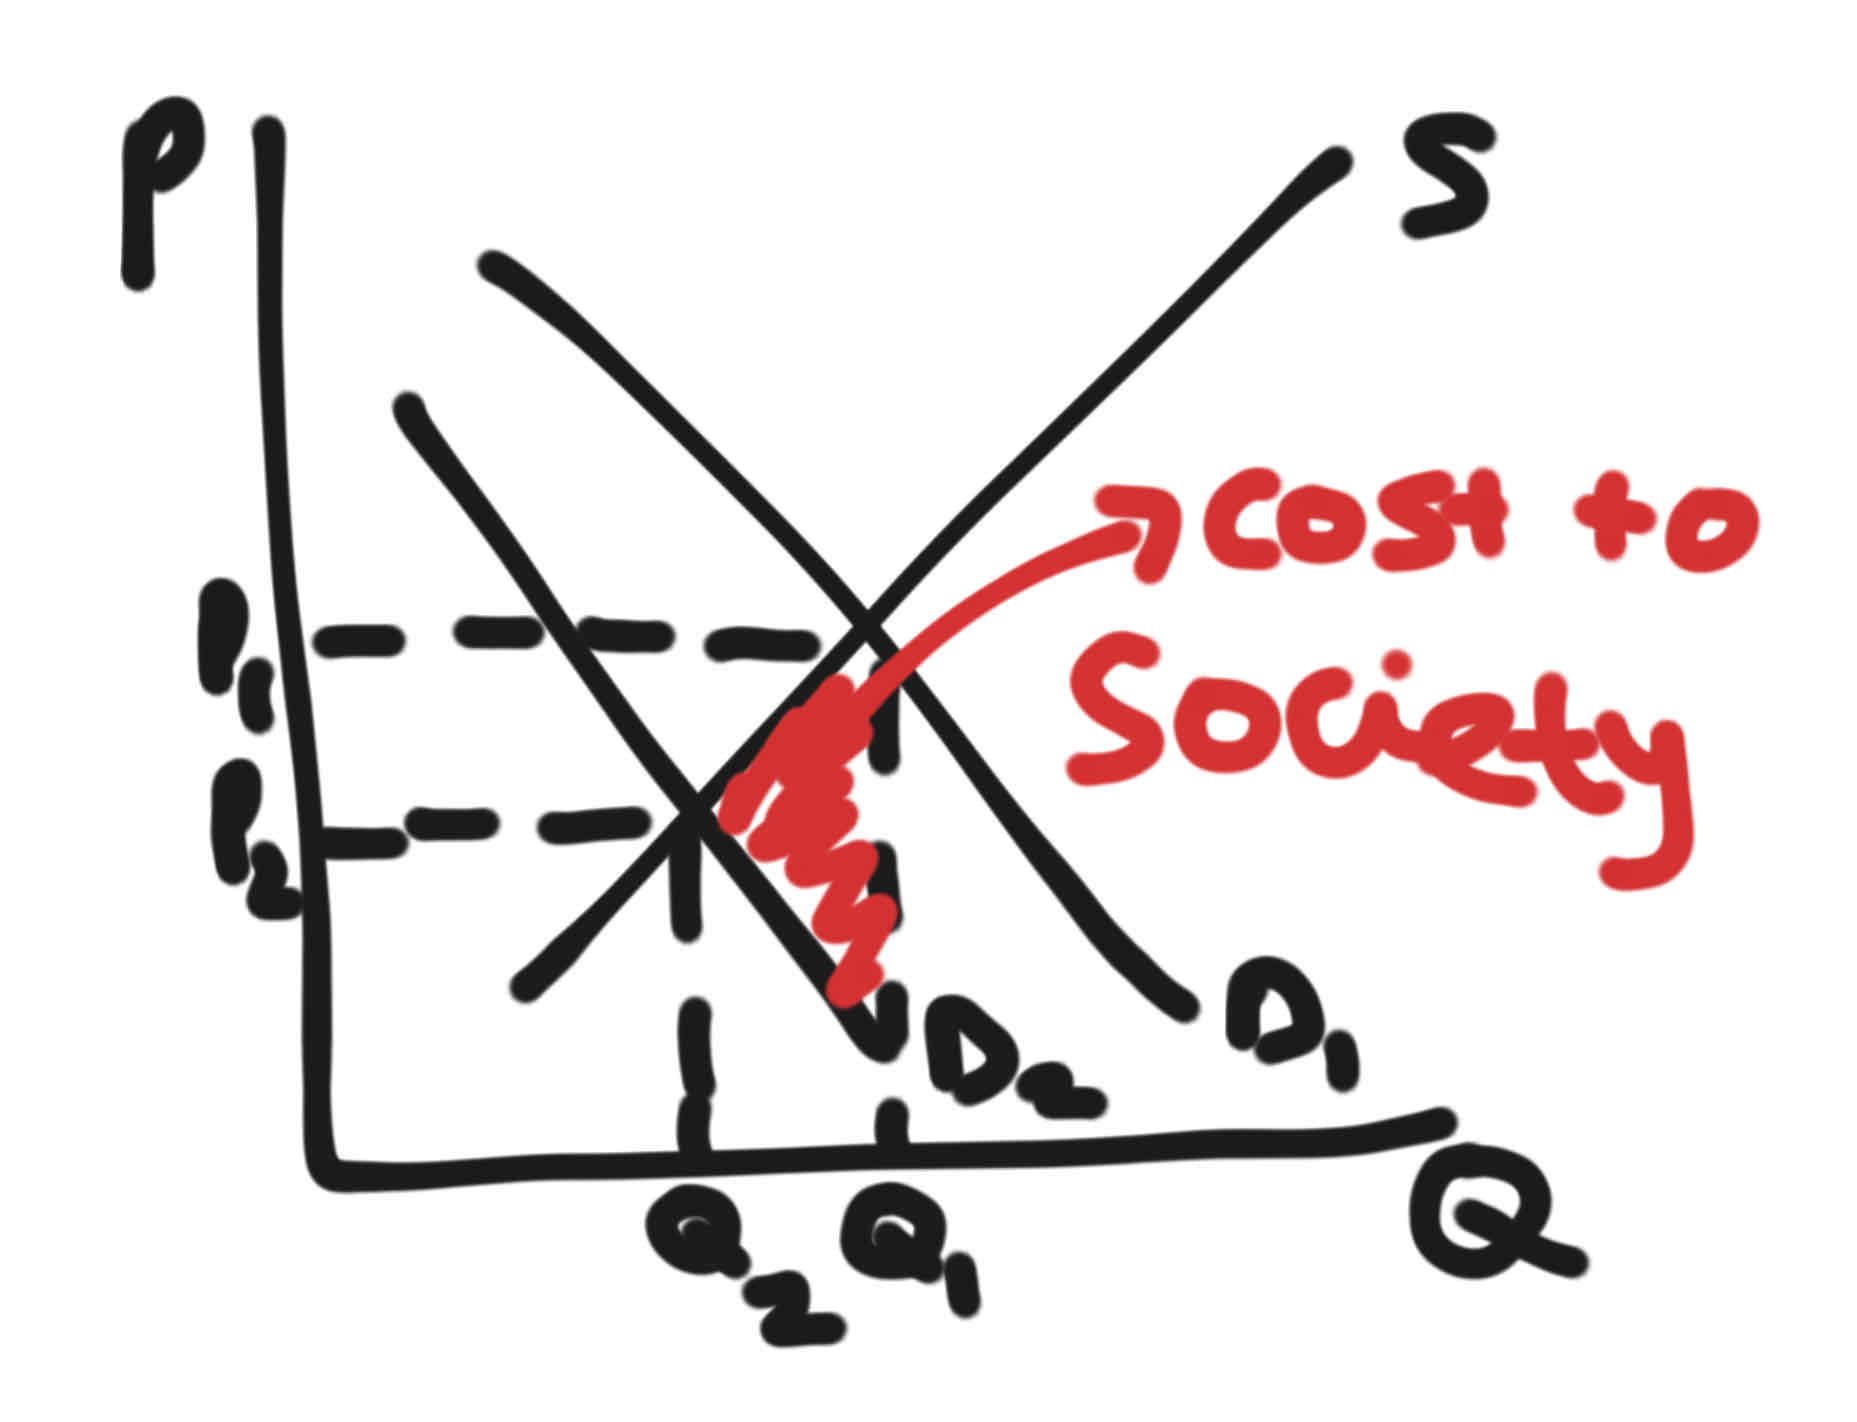
negative externality of consumption diagram
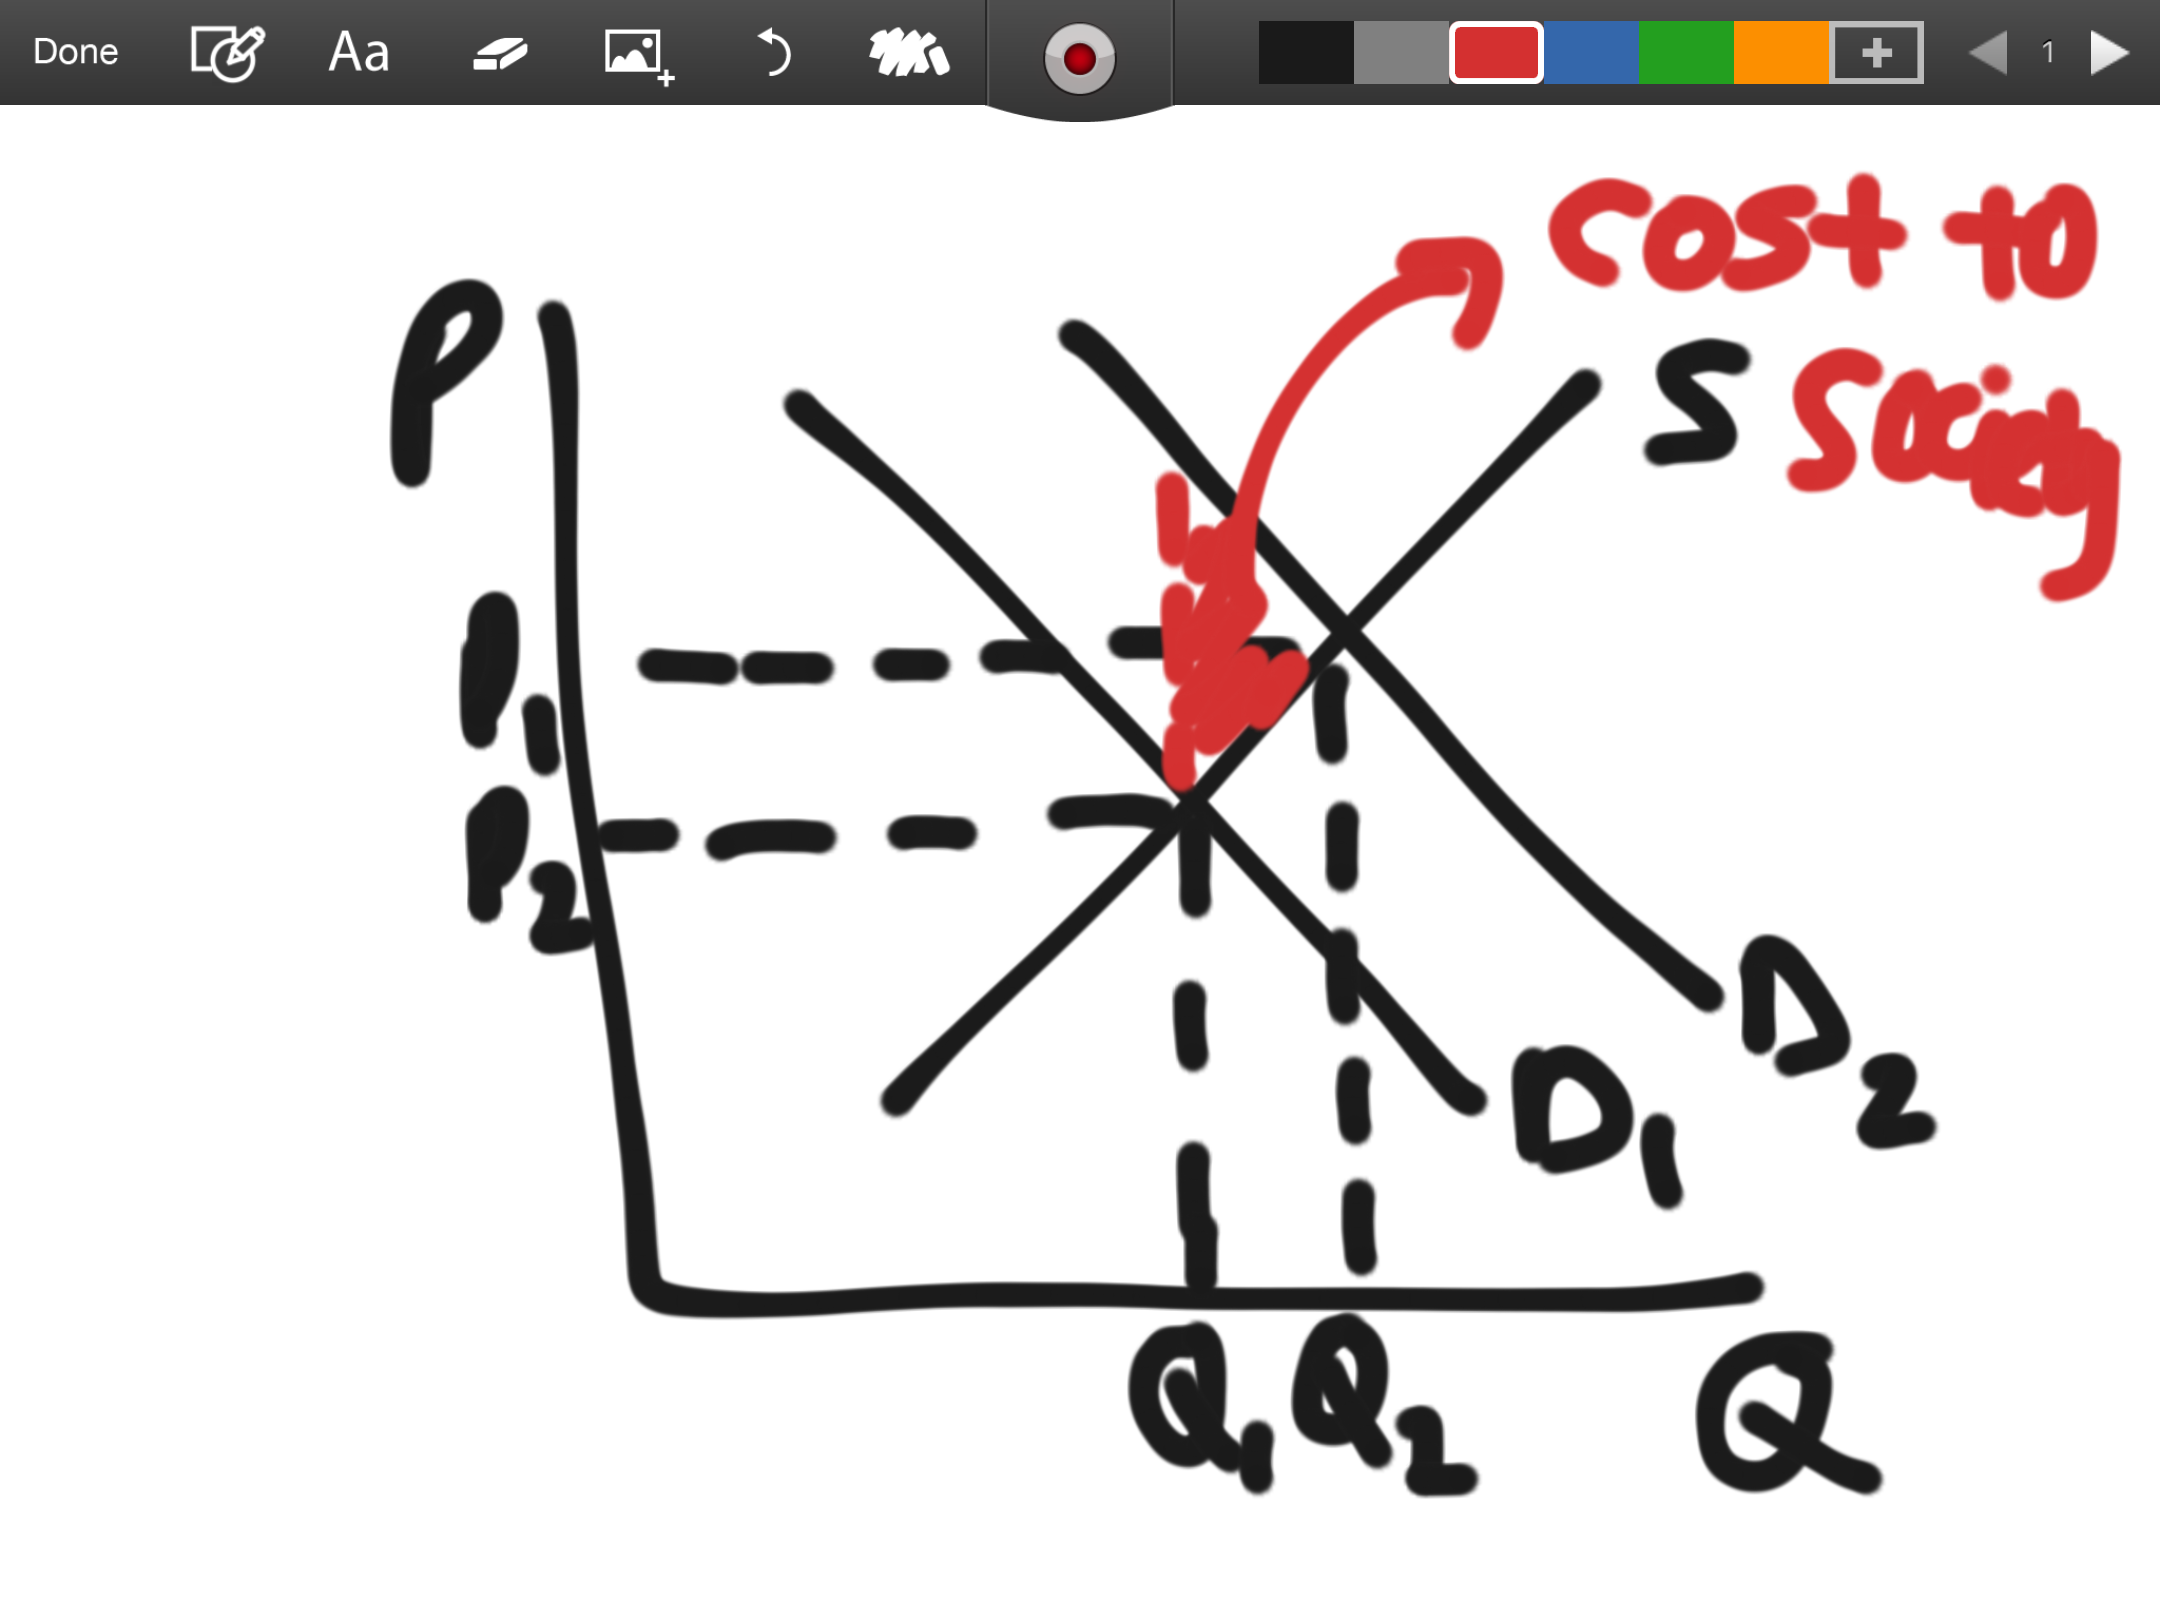
positive externality of consumption diagram