Cash is King
Phrase emphasizing the critical importance of cash flow in business operations
Importance of cash
Covers expenses
pays off debts
supports during economic downturns
Cash flow management
monitoring inflows and outflows
forecasting cash needs
maintaining adequate reserves
Why cash matters
smooth functioning of business
sustainability and growth
ability to withstand unforeseen circumstances
Working capital management
the process of managing a company’s short-term assets and liabilities to ensure efficient operations and liquidity
Components of working capital
current assets e.g., cash, inventory, accounts receivables
current liabilities e.g., accounts payable, short-term debt
Objective of working capital management
To optimize the balance between liquidity and profitability by ensuring that the company has enough short-term assets to cover short-term liabilities without excessive idle funds.
Strategies for working capital management
inventory management
Accounts receivable management
Accounts payable management
Cash flow forecasting
Benefits of effective working capital management
improved cash flow
Enhanced liquidity
Reduced financing costs
Better ability to seize opportunities and withstand financial shocks
Positive net working capital
company has enough short term assets to cover its short term liabilities
Negative working capital
potential liquidity issues
Investment : Company takes large new attractive new investment projects
finance : company needs to raise finance
Dividends : Cuts may be needed to increase internal financing if external sources not available
Dividends : company decides to pay higher level of dividends
finance : lower levels of retained earning available for investment have to find external sources
investment : if finance not available may have to postpone future investments projects
Finance : company finances itself using ,more expensive sources resulting high cost of capital
investment : the number of attractive projects to the company decreases
dividends : company’s ability to pay dividends in the future will be adversely affected
(EMH) Weak Form Efficiency
A form of the Efficient Market Hypothesis (EMH) suggesting that all past market prices and trading data are fully reflected in stock prices.
(EMH) Key Points of EMH
Investors cannot consistently achieve above-average returns by analyzing past stock prices.
Technical analysis, based on historical price movements, is not effective in predicting future prices
Weak form efficiency implies that neither fundamental nor technical analysis alone can provide an advantage in stock selection.
Implications of Weak form of efficiency
Investors cannot gain an edge through historical price analysis alone.
The random walk theory suggests that stock prices follow a random pattern, making short-term prediction difficult.
Efficient markets quickly incorporate new information into stock prices, making it challenging to outperform the market consistently
Criticism of Weak form efficiency
Critics argue that anomalies and market inefficiencies exist, challenging the idea of weak form efficiency.
Behavioral finance theories suggest that investor sentiment and irrational behavior can influence stock prices, contradicting the notion of fully reflecting all past information
Application of Weak form efficiency
investors may focus on other forms of analysis such as fundamental analysis to identify undervalued or overvalued stocks
Passive investing strategies, such as index funds, align with weak form efficiency by accepting market prices as fair and efficient.
Market participants may still seek informational advantages through research, despite the limitations of historical price data.
Weak form of Efficiency presented as
Pt = Pt-1 +
Semi-Strong Efficiency
A form of the Efficient Market Hypothesis (EMH) suggesting that all publicly available information is fully reflected in stock prices.
Key points for semi strong efficiency
Market prices adjust rapidly and accurately to new information, making it difficult for investors to consistently outperform the market
Fundamental analysis, based on public information like financial statements and economic data, is not sufficient to achieve above-average returns.
Semi-strong efficiency implies that even insider information cannot consistently generate abnormal returns, as it is quickly reflected in stock prices upon becoming public.
Implication of semi strong efficiency
Investors cannot gain an advantage by analyzing publicly available information alone.
Efficient markets lead to fair and unbiased stock prices, reflecting all available information.
Active investment strategies, such as stock picking and timing the market based on public news, are generally ineffective in the long term.
Criticism of semi strong efficiency
Critics argue that anomalies and inefficiencies exist, challenging the idea of semi-strong efficiency.
Behavioral finance theories suggest that investor sentiment and cognitive biases can lead to mispricing, undermining market efficiency.
Event studies and empirical evidence occasionally demonstrate delayed or incomplete price adjustments to public information, raising questions about market efficiency.
Application for semi strong efficiency
Investors may focus on other forms of analysis, such as technical analysis or sentiment analysis, to complement fundamental analysis in their decision-making process.
Passive investing strategies, such as index funds and exchange-traded funds (ETFs), align with semi-strong efficiency by accepting market prices as fair and efficient.
Market participants may still seek informational advantages through proprietary research or specialized knowledge, even though public information is quickly reflected in stock prices.
Strong Form Efficiency
A form of the Efficient Market Hypothesis (EMH) suggesting that all information, both public and private, is fully reflected in stock prices.
Key points of strong form of efficiency
Market prices adjust rapidly and accurately to all available information, including insider information.
Investors cannot consistently achieve above-average returns, even with access to private or insider information.
Strong form efficiency implies that no individual or entity can consistently outperform the market, as all information is already reflected in stock prices.
Implications of strong form efficiency
Investors cannot gain an advantage through any type of information, whether public or private.
Strong form efficiency leads to fair and unbiased stock prices, reflecting all available information, including insider knowledge.
Insider trading is considered illegal in many jurisdictions because strong form efficiency suggests that insider information provides no advantage in the market
Criticisms of strong form of efficiency
Critics argue that anomalies and inefficiencies exist, challenging the idea of strong form efficiency.
Empirical evidence occasionally demonstrates instances where market prices do not fully reflect private or insider information, suggesting potential limitations to strong form efficiency.
Behavioral finance theories suggest that cognitive biases and market sentiment can lead to mispricing, undermining the efficiency of stock prices.
Application of strong form of efficiency
Investors may focus on passive investment strategies, such as index funds or exchange-traded funds (ETFs), which accept market prices as fair and efficient.
Market participants may still seek informational advantages through proprietary research or specialized knowledge, despite the limitations of strong form efficiency.
Regulatory bodies monitor and enforce laws against insider trading to maintain confidence in market integrity and fairness.
Abnormal rate of return
A measure used in finance to assess the performance of an investment relative to its expected return, typically adjusted for risk.
Formula abnormal rate of return
Actual Return - Expected Return
Key points of abnormal rate of return
Actual return refers to the realized return earned on an investment over a specific period.
Expected return represents the anticipated return based on factors such as market conditions, asset characteristics, and risk.
A positive abnormal rate of return indicates that the investment outperformed expectations, while a negative abnormal rate of return suggests underperformance.
Interpretation of abnormal rate of return
Positive abnormal returns may indicate skilled investment management, superior analysis, or the exploitation of market inefficiencies.
Negative abnormal returns may suggest poor investment decisions, unforeseen risks, or market downturns.
Abnormal returns are often used to evaluate the effectiveness of investment strategies and to assess the performance of investment managers or financial analysts
Application of abnormal rate of return
Investors and analysts use abnormal returns to evaluate the success of investment decisions and to compare the performance of different investment opportunities.
Portfolio managers may strive to generate positive abnormal returns by identifying undervalued securities, timing market movements, or employing active trading strategies.
Researchers and academics use abnormal returns to study market efficiency, asset pricing models, and the impact of information on investment outcomes
(Excel Functions)
(Excel Functions)
(Excel Functions)
Equity
Assets - Liabilities
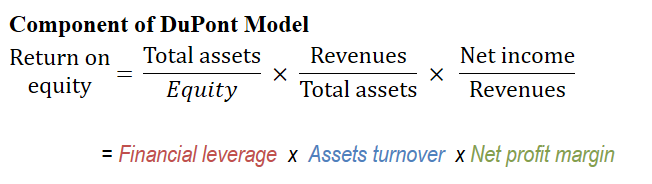
DuPont formula (ROE)
DuPont Analysis
Uses the relationship among financial statement accounts to decompose a return into components
Three Factors of DuPont analysis
financial leverage : capital structure
total asset turnover : measure efficiency
net profit margin : profitability
(Profitability) Gross profit margin
Gross Profit / total revenue
(Profitability) Net profit margin
Operating profit (PBIT) / total revenue
(Profitability) post tax profit margin
net profit / total revenue
(Profitability Returns) operating return on asset
operating profit / total assets
(Profitability Returns) ROCE
operating profit / capital employed
(Profitability Returns) Capital employed
total assets - current liabilities
(Profitability Returns) ROA
net profit / total assets
(Profitability Returns) ROE
net profit / equity
(Liquidity) Current ratio
current assets / current liabilities
(Liquidity) quick ratio
current asset - inventory / current liabilities
(Liquidity) cash ratio
cash + short term investments / current liabilities
(Efficiency ratios) inventory turnover period
( Inventory / cost of sales ) X 365
(Efficiency ratios) receivable collection period
( receivable / revenue ) X 365
(Efficiency ratios) payables payment period
( account payable / cost of sales ) X 365
Operating cycle
inventory turnover period + receivable collection period
Cash cycle
operating cycle - payables payment period
( Solvency ) Debt ratio
total debts / total assets
( Solvency ) debt to equity ratio
total debts / total equity
( Solvency ) Gearing
long term debts / capital employed
( Solvency ) financial leverage
total assets / total equity
( Solvency ) interest cover
PBIT / interest
( Earnings ) Earnings per share
Net income / number of ordinary shares
( Earnings ) Book value per share
shareholders equity - preferred shares / number of shares
( Dividends ) dividends per share
dividend paid to shareholders / number of ordinary shares
( Dividends ) dividend payout ratio
dividend paid to shareholders / net income
( Dividends ) Plowback ratio
1 - dividend ratio
(Excel Functions) Future Value
The value of an investment at a specified future date, based on a certain interest rate or rate of return
(Excel Functions) Formula of Future Value
Back: FV = PV × (1 + r)^n
Where: FV = Future Value PV = Present Value r = Interest rate or rate of return n = Number of periods
(Excel Functions) Present Value
The current value of a future sum of money, discounted at a certain interest rate to reflect its current worth
(Excel Functions) Formula for Present value
PV = FV / (1 + r)^n
Where: PV = Present Value FV = Future Value r = Interest rate or discount rate n = Number of periods
(Excel Function) Net Present Value
The difference between the present value of cash inflows and the present value of cash outflows over a period of time, used in capital budgeting to evaluate investment projects.
(Excel Functions) Formula for net present value
NPV = Σ [(Cash inflow / (1 + r)^n) - Cash outflow]
Where: NPV = Net Present Value r = Discount rate n = Number of periods
(Excel Function) payment PMT
The periodic payment made in an annuity or loan, consisting of both principal and interest.
(Excel Function) Number of Periods (NPER or MPER)
The total number of payment periods in an annuity or loan
Valuing Irredeemable instruments
An infinite series of periodic payments of a constant amount, typically representing a stream of income that continues indefinitely
Irredeemable instruments, also known as perpetuities, are financial securities that pay a fixed amount of interest indefinitely
Formula for Perpetuity
Perpetuity = Payment / Interest rate
Key points for valuing irredeemable instruments
Perpetuities offer fixed interest payments without a maturity date.
The present value of a perpetuity is calculated by dividing the payment by the interest rate.
Irredeemable instruments are commonly used in certain types of preferred stocks and government securities.
Valuing Fixed Interest Bonds
Fixed interest bonds are debt securities that pay a fixed rate of interest until maturity, at which point the principal is repaid.
(Excel Function) Formula for Present value or Fixed Interest Bond
PV = Σ [(C / (1 + r)^n) + (F / (1 + r)^n)]
Where: PV = Present value C = Periodic interest payment r = Discount rate n = Number of periods F = Face value or principal
Key points for Value of fixed interest bond
Fixed interest bonds have a fixed coupon rate and maturity date.
The present value of a fixed interest bond is calculated by discounting the future cash flows (interest payments and principal repayment) to their present value.
The discount rate used is typically the yield to maturity (YTM), representing the market's required rate of return for the bond.
Bond Concept
A debt instrument issued by governments, municipalities, corporations, or other entities to raise capital, typically consisting of fixed interest payments and a repayment of the principal amount at maturity.
Key Features of Bond concept
Fixed interest rate (coupon rate)
Maturity date
Face value (par value)
Issuer (government, corporation, municipality)
Credit rating
Coupon Rate
The fixed annual interest rate paid by the bond issuer to the bondholder, expressed as a percentage of the bond's face value
Maturity Date
The date on which the bond issuer repays the principal amount to the bondholder, marking the end of the bond's term
Face Value (Par Value)
The nominal value of the bond, which represents the amount repaid to the bondholder at maturity. It is typically $1,000 for corporate bonds and government bonds
Issuer
The entity that issues the bond to raise capital, such as governments, corporations, municipalities, or government-sponsored enterprises.
Credit Rating
An assessment of the issuer's creditworthiness, indicating the likelihood of timely repayment of interest and principal
Yield
he return earned on a bond, calculated as the annual interest payments divided by the bond's current market price. It represents the bond's effective interest rate
Valuing Convertible Debt
Depends on conversion value Po (1 + g)n R
the conversion ratio R
the current share price Po
share price growth rate g
the time to maturity or conversion n
Straight debt
Principle amount + Interest
Principal Amount: The initial amount borrowed or the face value of the debt.
Interest: The total interest payments over the life of the debt, calculated as Principal×Interest Rate×Time PeriodPrincipal×Interest Rate×Time Period.
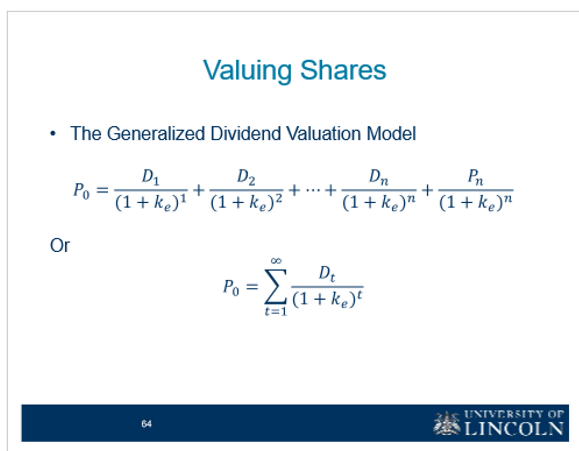
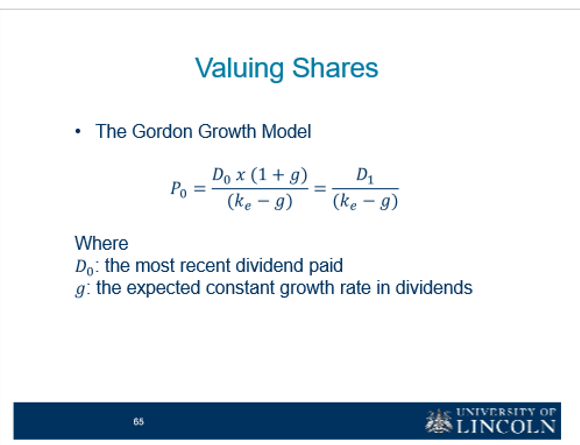
Valuing Shares
Gordon Growth model
Straight Line depreciation
Method allocating equal depreciation amounts to each period of an asset's useful life
Useful Life
Period over which an asset is expected to be used, determining the duration of depreciation calculations
Depreciation rate calculation
Convert depreciation percentage to a decimal by dividing by 100
Depreciation Rate Formula
Depreciation Rate = (Depreciation Percentage) / 100
Expense calculation
Multiply depreciation rate by initial cost or book value of the asset